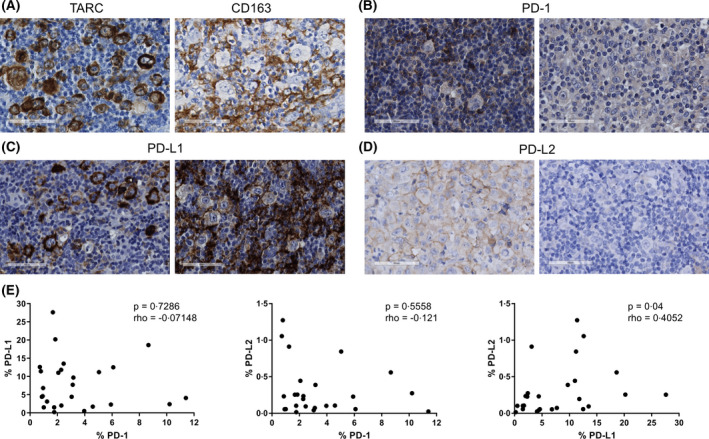
Fig 1.

Representative examples of the immunohistochemical staining of thymus‐ and activation‐regulated chemokine (TARC), CD163, programmed cell death protein 1 (PD‐1), programmed death‐ligand (PD‐L1) and PD‐L2. (A) A representative case staining positive for TARC in the Hodgkin‐Reed Sternberg (HRS) cells and a representative case showing CD163 staining in the tumour associated macrophages (TAMs). (B) A representative case with (left panel) and without (right panel) PD‐1+ cells in the rosettes. (C) A representative case staining positive for PD‐L1 in the HRS cells, but not in the tumour microenvironment (TME) (left panel) and a case without PD‐L1 staining in the tumour cells, but with PD‐L1 positive cells in the TME (right panel). (D) A representative case with (left panel) and without (right panel) PD‐L2 staining in the HRS cells. (E) Correlations between the percentages of positive pixels of PD‐1 with both PD‐L1 and PD‐L2 and between PD‐L1 and PD‐L2. The correlation analyses were performed using a Spearman’s rank correlation test. A P value <0·05 was considered to be statistically significant. [Colour figure can be viewed at wileyonlinelibrary.com]
