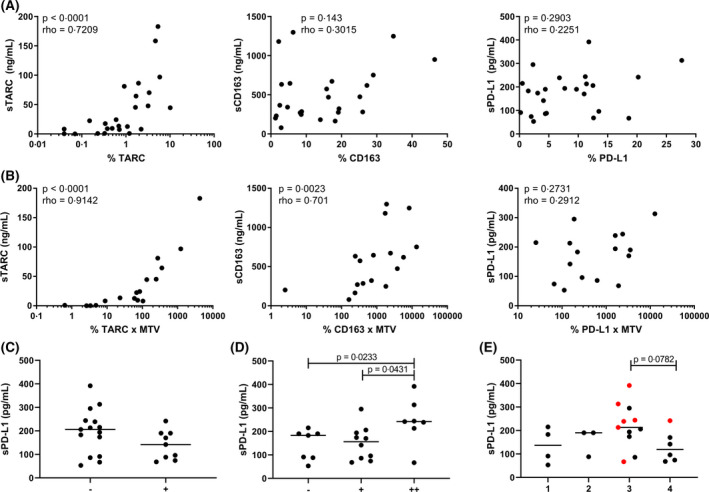
Fig 3.

Comparison between tissue expression and plasma levels. (A) The percentage of positive pixels for thymus‐ and activation‐regulated chemokine (TARC), CD163 and programmed death‐ligand 1 (PD‐L1) in tissue of classical Hodgkin lymphoma patients was correlated with the levels of soluble (s)TARC, sCD163 and sPD‐L1 in the plasma using a Spearman’s rank correlation test. (B) Correlation between the metabolic tumour volume (MTV) adjusted pixel percentages of TARC, CD163 and PD‐L1 with the plasma levels of sTARC, sCD163 and sPD‐L1 using a Spearman’s rank correlation test. For A and B, a P value of <0·01 was considered to be statistically significant. (C) Hodgkin Reed‐Sternberg (HRS) cells in each case were scored as negative (<25%) or positive (25% or above) for PD‐L1 and divided in groups accordingly. Levels of sPD‐L1 in the negative and positive group are displayed. (D) The tumour microenvironment (TME) of each case was scored as negative (−), positive (+) or strong positive (++) for PD‐L1 and divided in groups accordingly. Levels of sPD‐L1 in each group are displayed. (E) The evaluation of the HRS cells and TME were combined and divided in four groups: HRS‐TME‐ (group 1); HRS+TME− (group 2); HRS−TME+ (group 3) and HRS+TME+ (group 4). In red cases with a strong positive (++) TME are indicated. Two groups were compared using a Mann‐Whitney U test. For C, D and E, a P value of <0·05 was considered to be statistically significant. [Colour figure can be viewed at wileyonlinelibrary.com]
