Fig 4.

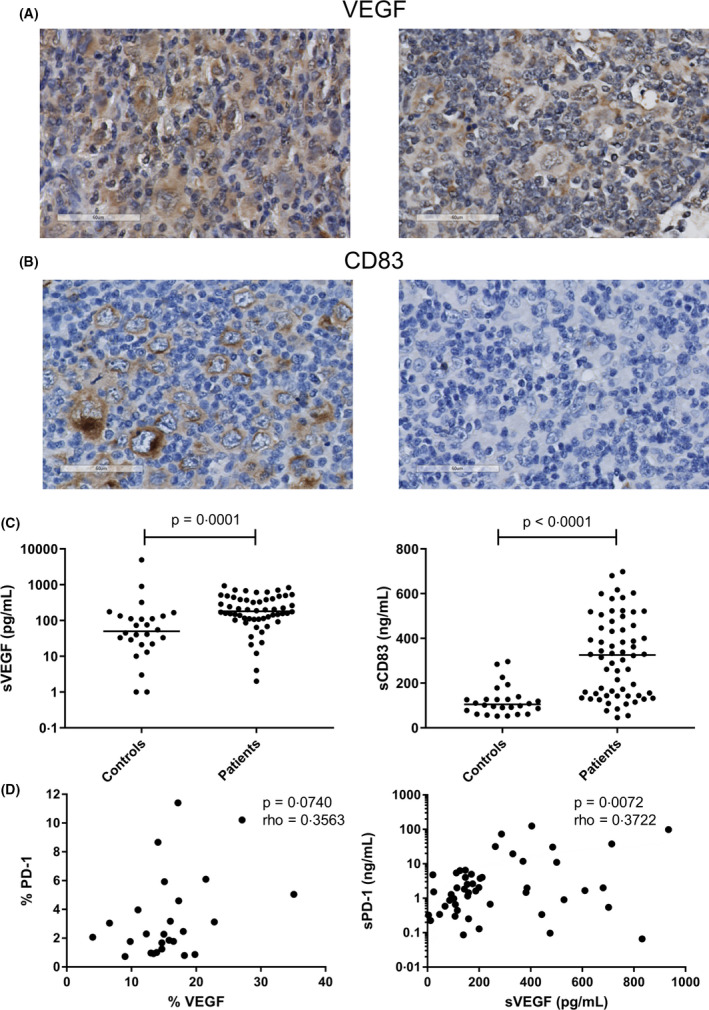
Effect of vascular endothelial growth factor (VEGF) and CD83 on the programmed cell death protein 1/programmed death‐ligand (PD‐1/PD‐L) axis. (A) Representative cases staining positive (left panel) and negative (right panel) for VEGF in the Hodgkin Reed‐Sternberg (HRS) cells. (B) Representative cases staining positive (left panel) and negative (right panel) for CD83 in the HRS cells. (C) Plasma levels of soluble (s)VEGF (pg/ml) (left panel) and sCD83 (ng/ml) (right panel) were compared between patients and controls using a Mann‐Whitney U test. (D) Correlation of VEGF and PD‐1 in both tissue (left panel) and plasma (right panel) using a Spearman’s rank correlation test. A P value of <0·05 was considered to be statistically significant. [Colour figure can be viewed at wileyonlinelibrary.com]
