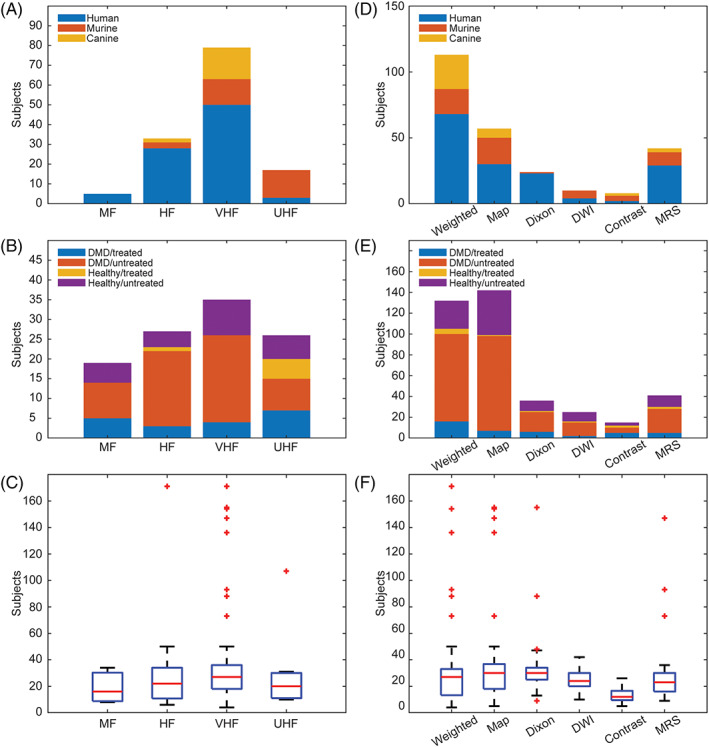
FIGURE 3.

Distribution of studies (subject type, population, and number of muscles assessed) by different field strengths (A‐C) and different MRI sequences (D‐F). HF, high field strength; MF, medium field strength; T1w, T1‐weighted; T2w, T2‐weighted; T1m, T1‐mapping; T2m, T2‐mapping
