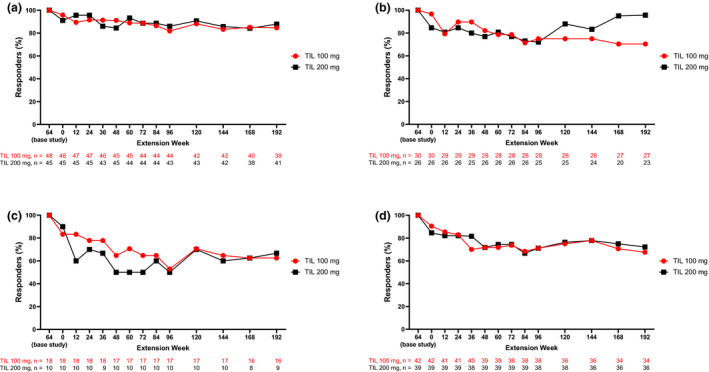
FIGURE 2.

Proportions of patients who maintained base study week 64 (a) PASI 75, (b) PASI 90, (c) PASI 100, and (d) PGA 0/1 through extension week 192. Includes patients who had the indicated response level at week 64. Numbers of patients with data at each time point shown are shown below the graph; percentages are based on patients with data. PASI, Psoriasis Area and Severity Index; PGA 0/1, Physician Global Assessment of clear or minimal with ≥2‐grade improvement from baseline; TIL, tildrakizumab.
