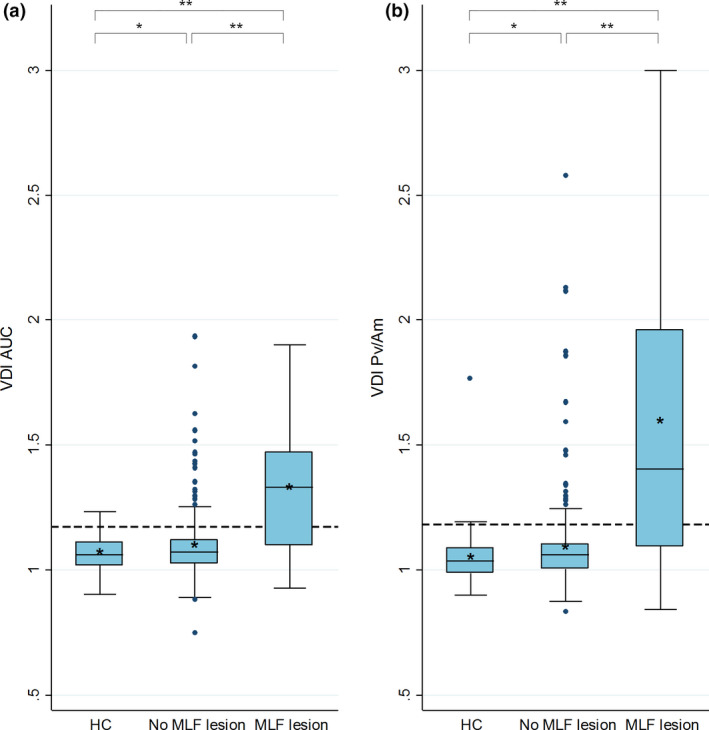
FIGURE 2.

Versional dysconjugacy index (VDI) distribution of the HC group and MS subgroups. Box‐and‐whisker plots of the VDI of the healthy control group, MS patients without a medial longitudinal fasciculus (MLF) lesion and MS patients with an MLF lesion on MRI. Both leftward and rightward VDI of every subject was included. The boxes extend from the 25th to the 75th percentile; the horizontal line in the box is plotted at the median and the asterisk indicates the mean. The dashed line indicates the INO detection threshold of both VDIs. *p < 0.05; **p < 0.001. (a) VDI area under the curve (AUC). VDI detection threshold at 1.174. (b) VDI peak velocity divided by amplitude (Pv/Am). VDI detection threshold at 1.180. [Colour figure can be viewed at wileyonlinelibrary.com]
