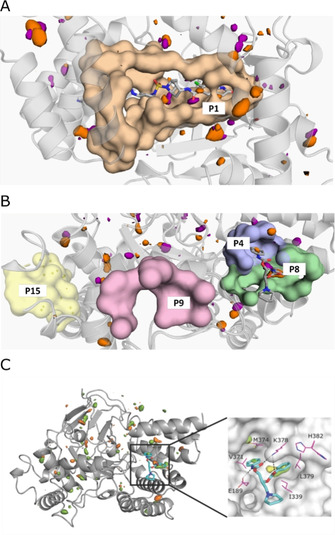
Figure 5.

Identification of potential allosteric sites by in silico pocket detection and solvent mapping. Potentially druggable cavities identified by fPocket calculations. The surfaces show contours of residues lining the pockets; hydrophobic and polar binding hotspots identified by solvent mapping are shown as orange and purple contours, respectively. Druggability scores are presented in Table 2. SAM and (S)‐diperodon (sticks) are displayed for reference but were not included in the calculation. A) SAM binding pocket (P1). B) Diperodon binding site (split into two pockets: P4 and P8) and other pockets with high fPocket druggability score. C) Left: Structure of SMYD3 highlighting hotspots for ligand binding identified through mixed‐solvent MD simulations using MDMix. All binding pockets indicated by fPocket were probed, and high‐ and low‐energy areas identified. The low‐energy areas probed by ethanol (orange) help to identify donor or acceptor features that may be exploited for ligand binding. Hydrophobic sites (orange) were also probed. Right: Close up of the interaction hotspots within the allosteric diperodon site, highlighted using ethanol–water (yellow) and acetamide–water (green) descriptors. The two phenyl substituents of (S)‐diperodon occupy two distinct hydrophobic pockets, whereas the carbamates form polar contacts with the protein.
