
Figure 11.
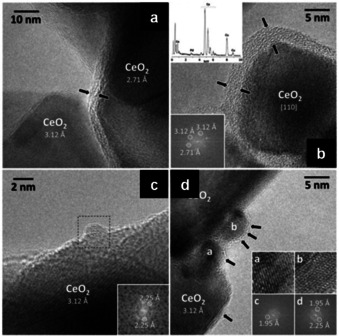
HRTEM images highlight the main features of PdCeM. (a,b) The ceria crystallites are covered by an amorphous layer (2–5 nm thick), delimited by black arrows. Top, left inset in b: EDX spectrum of the amorphous layer; bottom‐left inset in (b): lattice fringes of the ceria crystallites. (c, d) Representative palladium nanoparticles, decorating the ceria crystallites, with corresponding lattice fringes shown as an inset. Adapted with permission from ref. [86]. Copyright 2018 Wiley‐VCH.