
Figure 12.
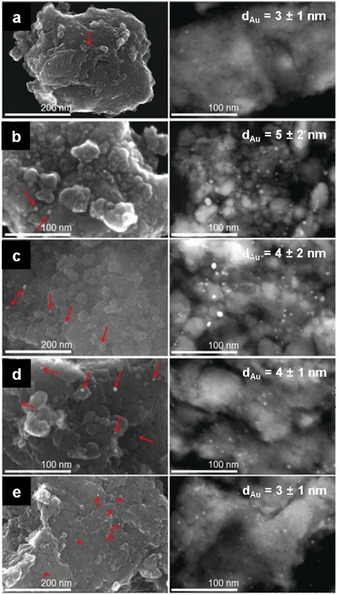
From top to bottom, electron micrographs of gold nanoparticles on (a) α‐Fe2O3, (b) Co3O4, (c) α‐Al2O3, (d) nano‐TiO2, and (e) TiO2 HombiKat. All the materials were obtained after 3 h of ball milling under a continuous flow of the following gas mixture: 1 % CO, 20 % O2, 79 % He. On the left, SEM images of the mentioned samples (red arrows point at the gold nanoparticles) and, on the right, STEM images of the corresponding microtomic cuts (average Au particle diameters, with standard deviations, are reported on the micrographs). Adapted with permission from ref. [37]. Copyright 2019 Wiley‐VCH.