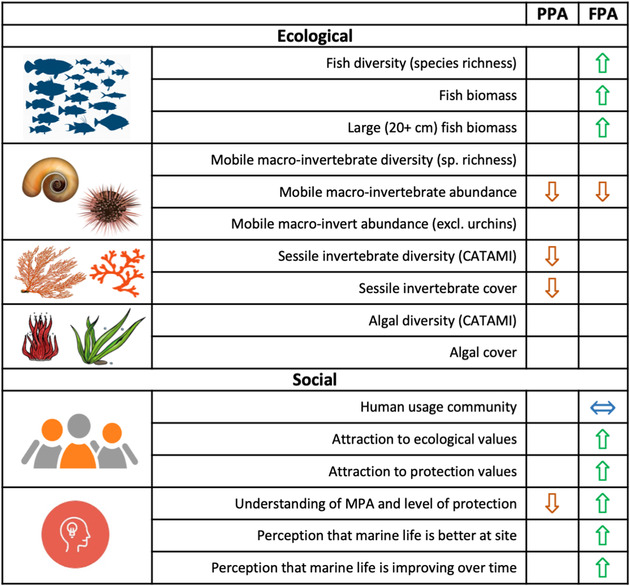
Figure 2.

Summary of results of multivariate and univariate analysis for partially protected areas (PPAs) and fully protected areas (FPAs) compared with open areas (blank cell, no significant difference between protected and open areas; up arrow, positive significant relationship [e.g., more fish diversity and biomass]; down arrow, negative significant relationship; left and right arrow combined, significantly different community with more of some users and fewer of others; CATAMI, Collaborative and Automated Tools for Analysis of Marine Imagery [Althaus et al. 2013]; p < 0.05, benchmark for significance based on permutational multivariate analysis of variance for community results and mixed‐effects linear regression for other results). The p‐values and effect sizes are in Appendix S7.
