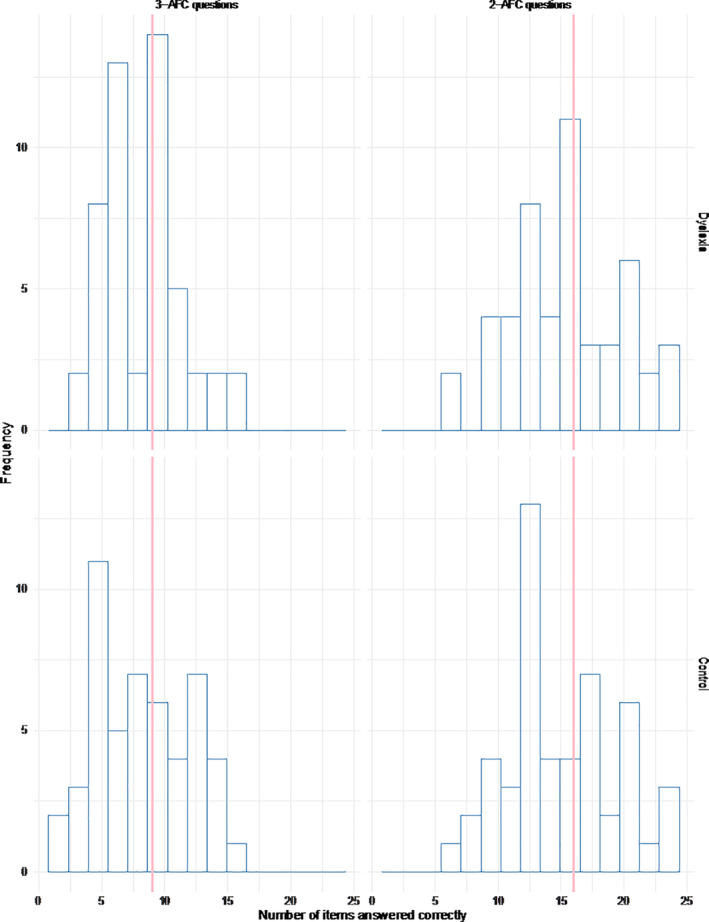
FIGURE B1.

Histogram of items correct. The pink lines represent the level at which individuals exceed chance level as determined by the binomial distribution (see Section 3.3.3; 16/24 or higher for 2‐AFC and 9/16 or higher for 3‐AFC) [Colour figure can be viewed at wileyonlinelibrary.com]
