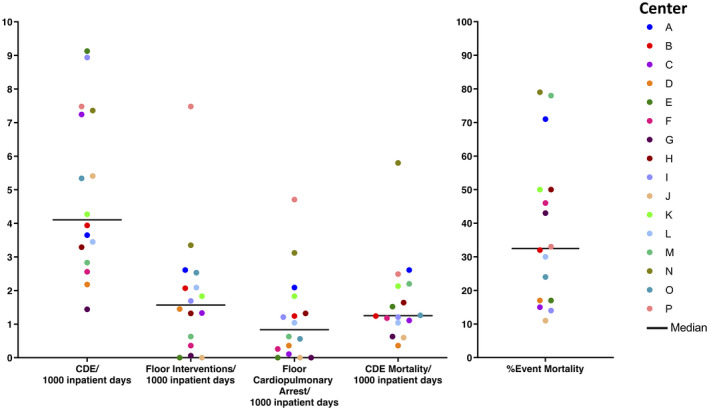
Figure 2.

Center variations in the rates of clinical deterioration events (CDEs) and mortality are illustrated. Variations in the rates of CDE per 1000 inpatient days, floor intensive care unit‐level interventions per 1000 inpatient days, floor cardiopulmonary arrests per 1000 inpatient days, CDE mortality per 1000 inpatient days, and the percent mortality of all documented CDEs are depicted. Each dot color represents 1 center (n = 16), and the dark black line indicates the median in each category.
