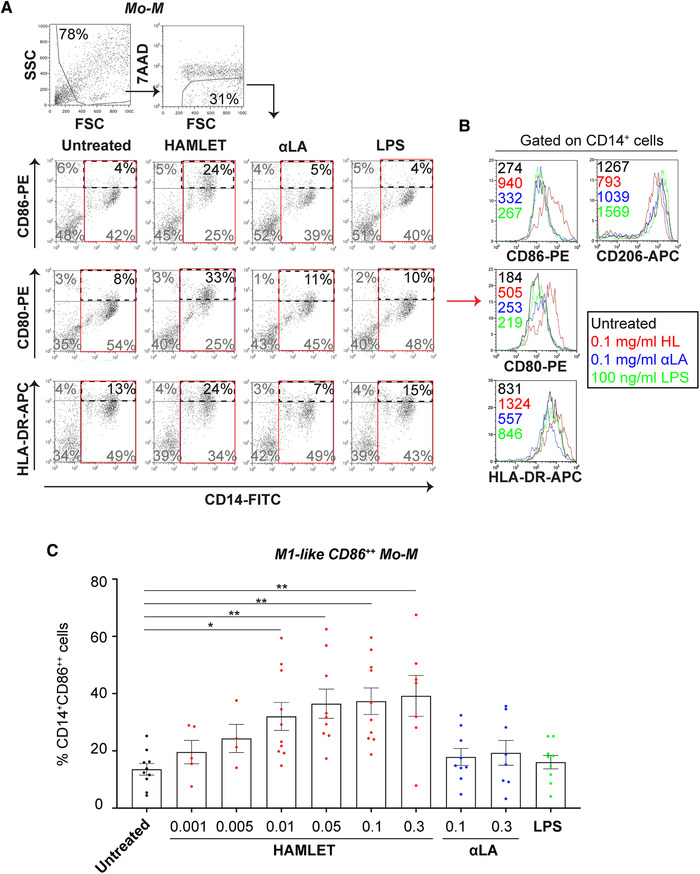
Figure 3.

HAMLET induces an M1‐like Mo‐M surface phenotype. Flow cytometric analyses of primary human Mo‐M treated in SFM with HAMLET (red), native αLA (blue) or LPS (green) for 1‐h and grown over night in fresh differentiation medium. (A) Gating strategy and dot plots of CD14, CD86, CD80 and HLA‐DR from cells treated with 0.1 mg/ml HAMLET or αLA or 100 ng/ml LPS. Gated on all viable cells, with percentage (%) of cells in gate indicated. (B) Histograms represent mean fluorescence intensity (MFI; values in graphs) of indicated receptors, gated on all CD14+ Mo‐M (red box in A). (C) Individual data points of percentages (%) CD14+CD86++ M1‐like Mo‐M, with mean and SEM shown. Data from 4–10 individual experiments (n = 4‐10 donors). Statistics by Kruskal‐Wallis with Dunn's multiple comparisons test to untreated control. *P<0.05 and **P<0.01.
