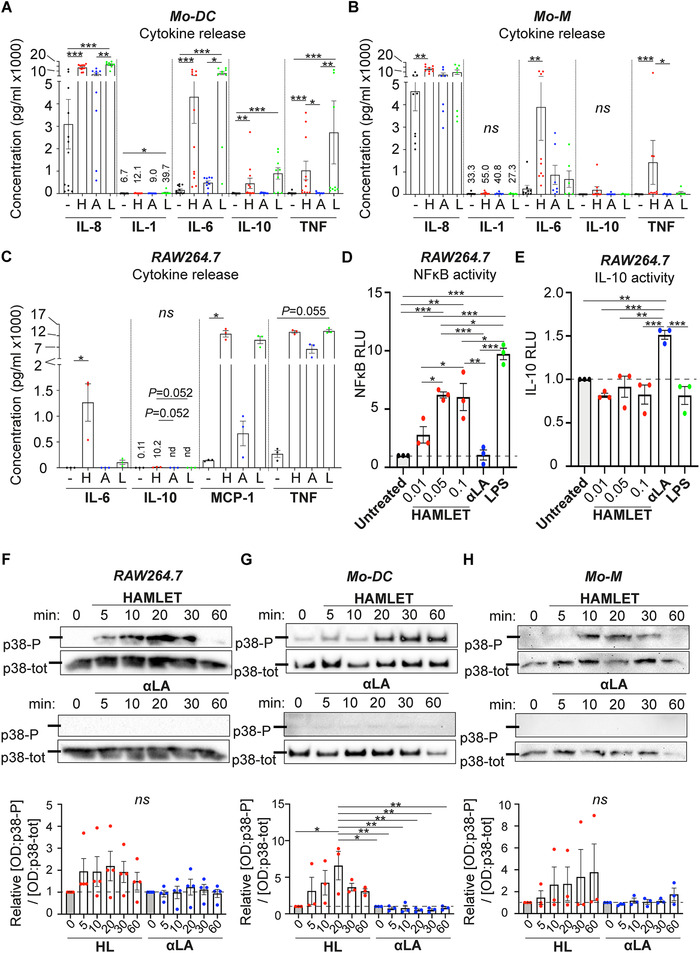
Figure 4.

HAMLET induces NFκB and p38 activation. (A‐C) Supernatants from primary human Mo‐DCs (A), Mo‐M (B) and RAW264.7 cells (C) stimulated in SFM with 0.1 mg/ml HAMLET (red) or native αLA (blue) or with 100 ng/ml LPS (green) for 1‐h and grown overnight in fresh differentiation medium, were analyzed by cytometric cytokine bead array (CBA). Individual data points of respective cytokine concentration (pg/ml) with mean and SEM are shown. Data from 7–12 individual experiments (n = 7‐12 donors) (A‐B) or N = 3 individual experiments with one technical replicate per experiment (C). Statistics by Kruskal‐Wallis with Dunn's multiple comparison test between all samples. ns = not significant, *P<0.05, **P<0.01, ***P<0.001. (D‐E) Dual luciferase NFκB (D) or IL‐10 (E) promoter assay using murine RAW264.7 macrophages. The relative dual luciferase units (RLU) were measured using pTK‐Renilla and pCMV‐Renilla vector, respectively, as controls. Individual data points of relative promoter activity (RLU) to untreated control with mean and SEM are shown. N = 3 individual experiments with mean of two technical replicates per experiment. Statistics by one‐way ANOVA with Tukey's multiple comparison test. *P<0.05, **P<0.01 and ***P<0.001. (F‐H) RAW264.7 cells (F), primary human Mo‐DCs (G) and Mo‐M (H) were treated with 0.1 mg/ml HAMLET or native αLA for indicated time points and analyzed by Western blot for phosphorylated p38. Total p38 are used as loading control. Lines indicate the 40 kD molecular weight marker. Blots are representative of N = 3‐4 individual experiments (one donor per experiment). The blots have been cropped for presentation purposes (raw data shown in Supplemental Fig. 10). Graphs depict relative [OD of p38‐P]/[OD of p38‐tot] to 0‐min untreated control, with mean and SEM shown. N = 3‐4 experiments. Statistics by one‐way ANOVA with Tukey's multiple comparison test between all samples. ns = not significant, *P<0.05 and **P<0.01.
