FIGURE 5.

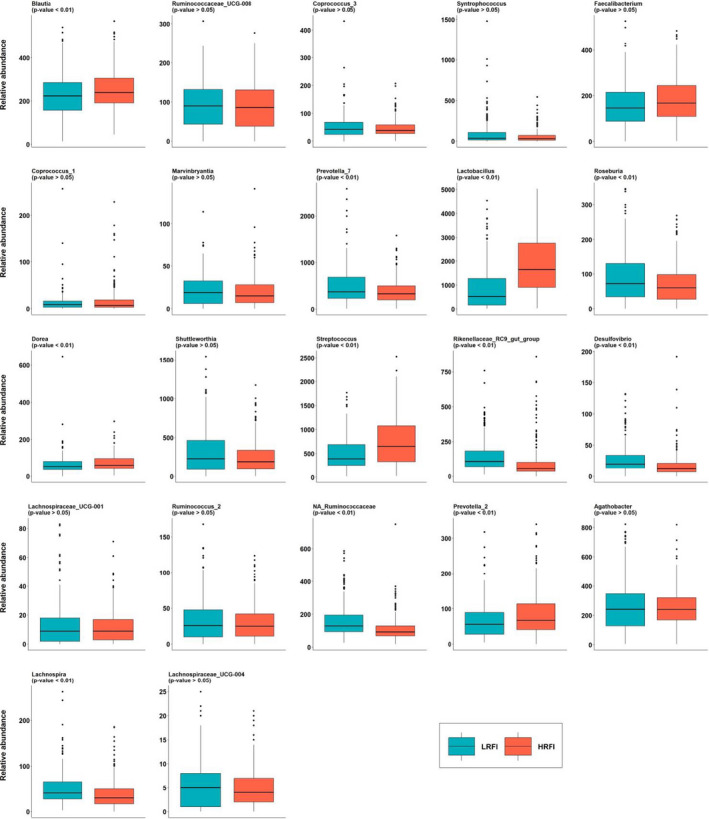
Box plots of genera abundances per line (LRFI, low residual feed intake; HRFI, high residual feed intake) and p‐value of ANOVA test of the line differences

Box plots of genera abundances per line (LRFI, low residual feed intake; HRFI, high residual feed intake) and p‐value of ANOVA test of the line differences