
Fig. 2.
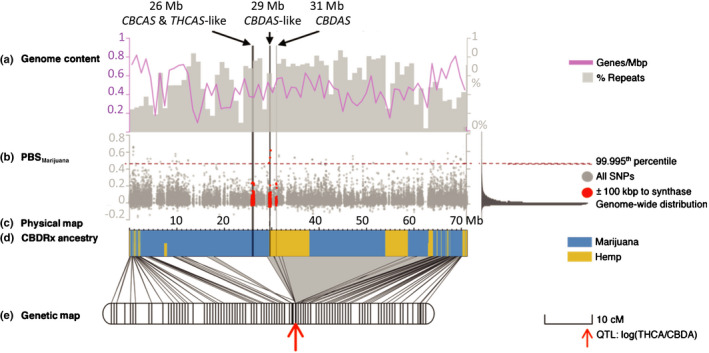
The location of cannabinoid synthase gene sequences on chromosome 7 in high‐cannabidiol (CBD) cultivar (CBDRx) Cannabis sativa is associated with evidence of recent selection for hemp ancestry introgressed into a marijuana background and maps to a quantitative trait locus (QTL) for the ratio of tetrahydrocannabinol (THC) : CBD. Vertical lines transecting the upper four panels indicate the locations of three cannabinoid synthase gene arrays. (a) Gene content (pink lines) and percentage repeat content (gray bars) of a 1 Mb sliding window across chromosome 7. (b) Manhattan plot of the population branch statistic (PBS), an F ST‐based, three‐population test with extreme values suggesting lineage‐specific evolutionary processes. Values for the marijuana branch are displayed in gray dots with a histogram of the genome‐wide distribution on the right. A dashed red line marks the 99.995th percentile of the distribution. Points within 100 kbp of cannabinoid synthase array are also colored red. (c) Physical length of chromosome 7. (d) Ancestry estimates for genomic segments derived from marijuana (blue) and hemp (yellow). (e) Genetic map of an F2 mapping population of Skunk#1 × Carmenanchored to the physical map using 1175 Illumina‐based whole genome sequencing (WGS) marker bins dervied from 22 280 segregating markers (211 106 for all chromosomes genome‐wide). Lines connecting the maps indicate the positions of markers in physical and genetic space. Shaded in gray are consecutive physical markers associated with genomic regions of low recombination. The red arrow marks the position of the only QTL associated with the THC : CBD ratio.