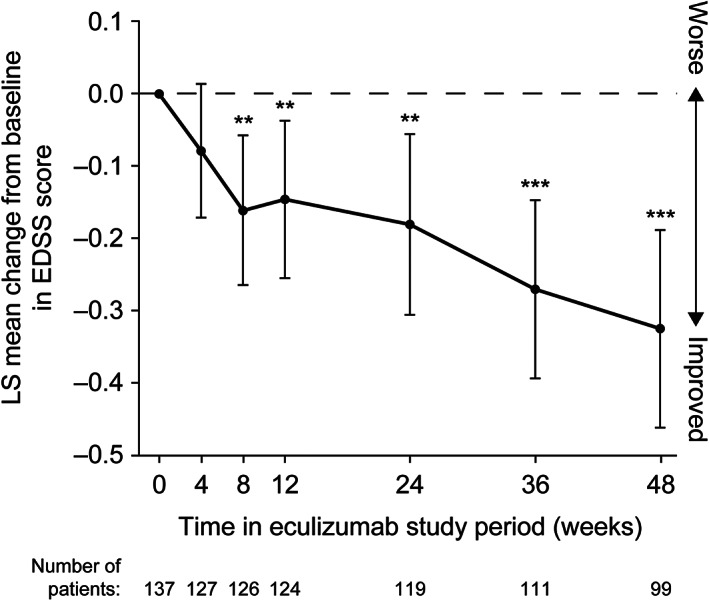
FIGURE 4.

Change from eculizumab baseline in EDSS score over time through 1 year in the combined PREVENT and OLE eculizumab group. *, **, and *** represent the 2‐sided nominal p value of 0.05, 0.01, and 0.001, respectively, testing whether the LS mean change from baseline equals 0. The LS mean, 95% CI, and p value are from a restricted maximum likelihood based repeated‐measures analysis of change from eculizumab baseline. The repeated‐measures model included terms of visit and baseline score. OLE visits at weeks 26, 40, and 52 are shown as weeks 24, 36, and 48, respectively. CI = confidence interval; EDSS = Expanded Disability Status Scale; LS = least‐squares; OLE = open‐label extension.
