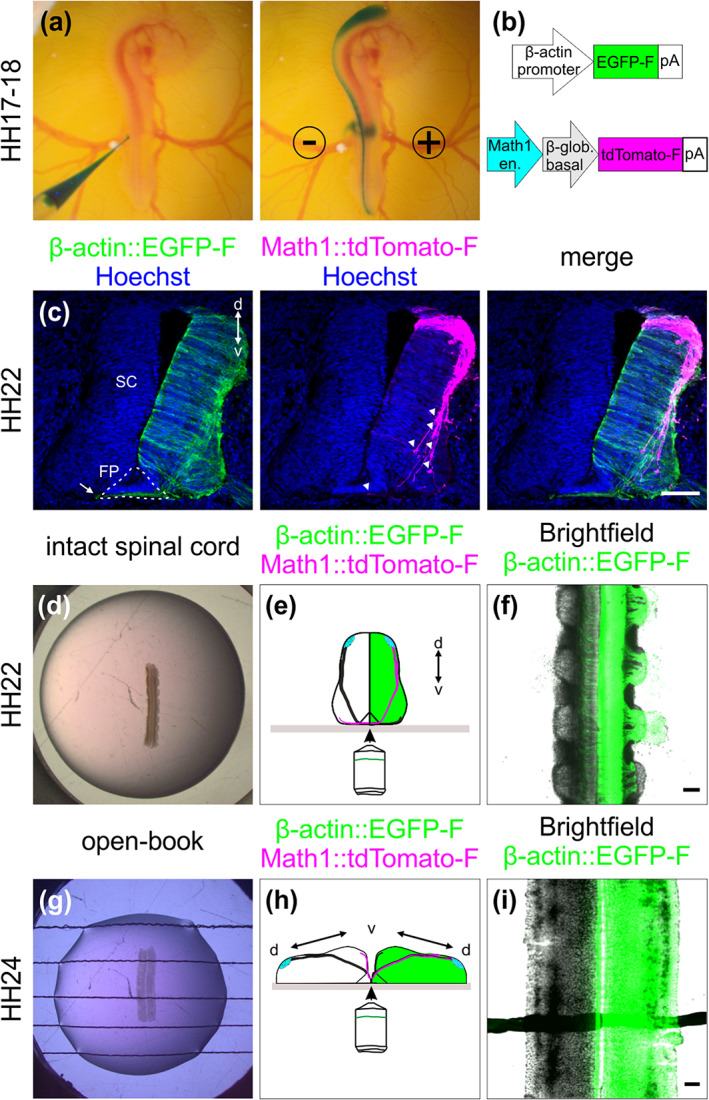
FIGURE 2.

Labeling strategy for dI1 interneurons and spinal cord (SC) culture systems. (a–c) In ovo injection and electroporation of a plasmid mix to specifically label dI1 interneurons. (a) The plasmid mix was injected into the central canal of the SC of HH17‐18 chicken embryo in ovo, followed by unilateral electroporation. (b) Plasmid constructs injected to target all cells (β‐actin::EGFP‐F) and dI1 interneurons (Math1::tdTomato‐F). en., enhancer; β‐glob., β‐globin. (c) Immunostaining of a transverse cryosection of a HH22 SC taken from an embryo sacrificed 1 day after electroporation with the plasmids indicated in (b). At this stage, most dI1 growth cones were approaching the FP area, but none of them had crossed it yet (white arrowheads). However, a substantial number of Math1‐negative, but EGFP‐F‐expressing commissural axons of more ventral populations had already crossed the FP at HH22 (arrow). (d–f) Intact SC culture. (d) Intact SCs of embryos injected and electroporated 1 day earlier were embedded with the ventral side down in a drop of low‐melting agarose. (e) The ventral SC area was imaged with an inverted spinning disk microscope. The green‐colored hemisphere represents the electroporated side of the SC. (f) Low magnification overview of a SC visualized with this set‐up with cells expressing EGFP‐F under the β‐actin promoter on one side merged with the bright‐field image. (g–i) Culture of an open‐book preparation of a SC. (g) Intact open‐book preparations of HH24 SCs dissected from embryos injected and electroporated about one and a half day earlier were embedded with the apical side down in an agarose drop with strings to hold it in place. (h) The midline area was visualized with the same inverted spinning disk microscope as above. The green‐colored hemisphere represents the electroporated side of the SC. (i) Low magnification overview of a SC visualized with this set‐up with cells expressing EGFP‐F under the β‐actin promoter on one side merged with the bright‐field image. d, dorsal; v, ventral. Scale bars: 100 μm
