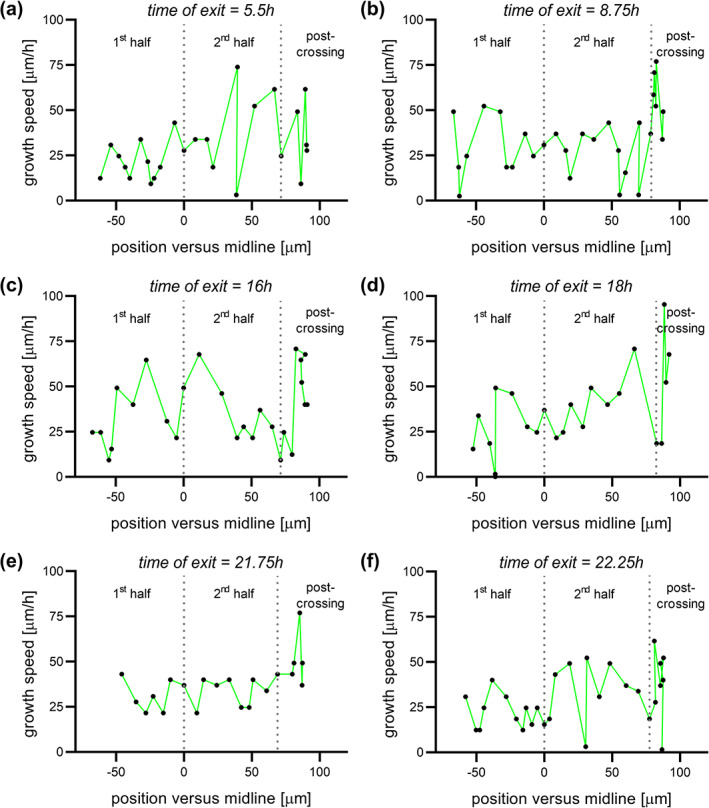
FIGURE 8.

Virtual tracing of axons exiting the floor plate (FP) at different time points. Examples of local growth speed at different time points of axons exiting the FP after 5.5 h (a), 8.75 h (b), 16 h (c), 18 h (d), 21.75 h (e), or 22.25 h (f) of culture plotted against the position of the growth cone in the FP. Dotted lines represent the time at which the axon crossed the midline or exited the FP. All axons were growing with pulses of acceleration and deceleration. There was no difference between early or late crossing axons
