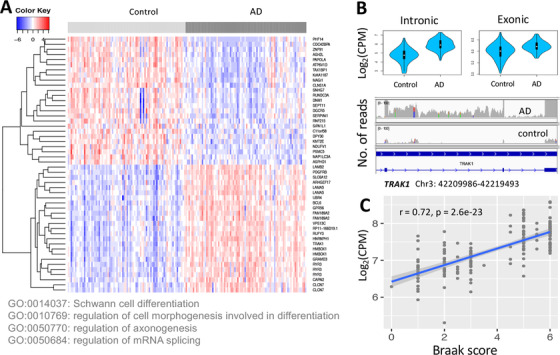
FIGURE 5.

Association of intron retention (IR) with Alzheimers’ disease (AD). (A) Heat map based on the 50 most differentially expressed retained introns (DEIs) (the top 25 up‐regulated and the top 25 down‐regulated) and the Gene Ontology biological process terms enriched in all differentially expressed introns (DEIs). (B) An example of DEI (chr4:42209986‐42219493) whose parental gene ENSG00000182606 (TRAK1) was not differentially expressed based on exonic reads (CPM: counts per million). The read coverage of this intron in an AD and a control sample is shown using Integrative Genomics Viewer. (C) The correlation of the intron (chr8:29056685‐29063881) of ENSG00000147421 (HMBOX1) with Braak score, a measurement of tau pathology severity of AD
