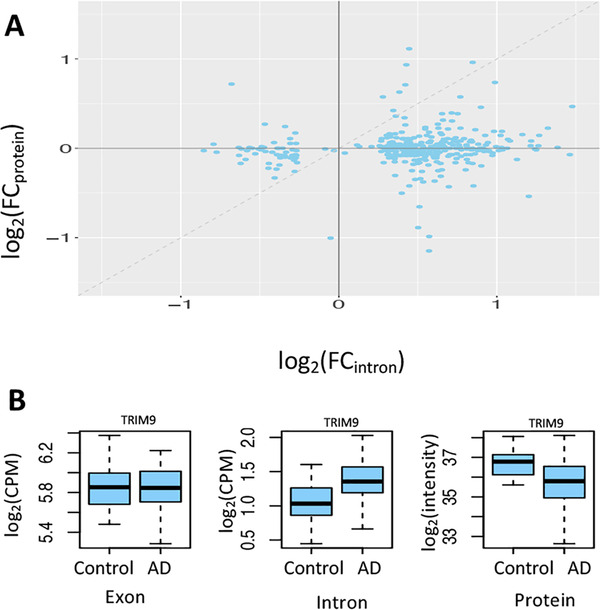
FIGURE 6.

Influence of intron retention (IR) on protein production. (A) Increased intron expression is associated with reduced level of protein expression (note that the dashed line only indicates the diagonal and is not obtained by fitting the points with a linear regression model). Each point corresponds to a gene/protein. The x‐axis is the log2 transformed fold change (FC) of retained intron expression between AD and controls, denoted by log2(FCintron). The y‐axis is the log2 transformed fold change (FC) of protein expression between the same set of Alzheimer's disease (AD) and controls, denoted by log2(FCprotein). When intron expression is higher in AD (ie, log2[FCintron]) > 0), the value of log2(FCprotein) is mostly smaller than log2(FCintron) (ie, below the diagonal line). When intron expression is lower in AD (ie, log2[FCintron] < 0), the value of log2(FCprotein) is mostly higher than log2(FCintron) (ie, above the diagonal line). This observation suggests that the protein expression for the gene with higher retained intron expression tends to decrease more than that for the same gene with lower retained intron expression, likely secondary to nonsense‐mediated decay (NMD). (B) An example suggesting NMD. For the TRIM9 gene, its mRNA expression level is similar between AD and control samples. However, the intron expression level in AD is significantly higher than that in control samples, with reduced level of protein expression likely due to increased activity of NMD
