
FIGURE 7.
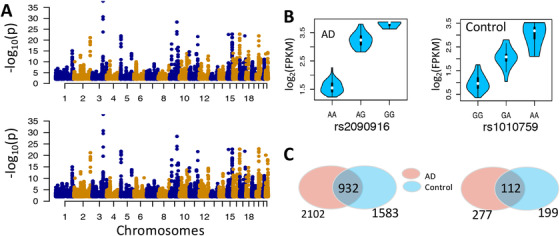
Intron expression quantitative trait loci (ieQTL) analysis. The ieQTLs were identified using MatrixEQTL at the threshold of false discovery rate (FDR) <0.05. (A) Manhattan plot of eQTLs for AD (upper panel) and control (lower panel) samples. (B) Example associations between intron expression level and genotypes. The retained introns shown the left and right are chr3:150584242‐150585393 and chr20:35545404‐35547261, respectively. (C) The sharing of ieQTL (left panel) and retained intron (right panel) between AD and control group