
FIGURE 8.
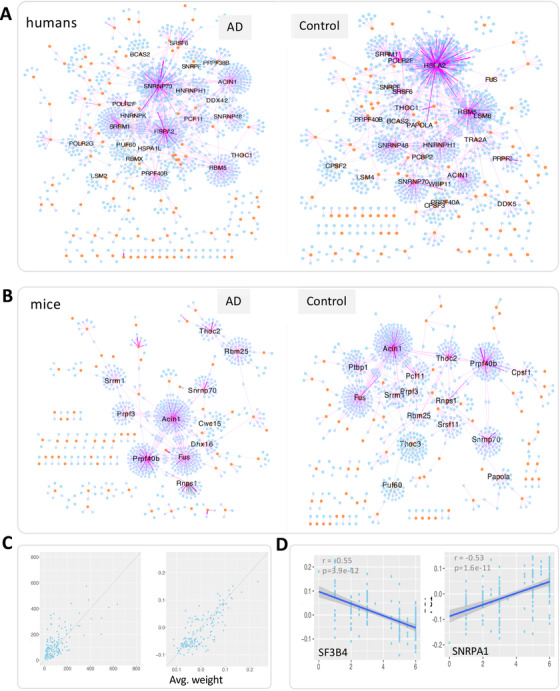
SPIRONs and the association of network modules with Braak score. (A) The human SPIRONs built with Alzheimer's disease (AD) and control samples, respectively. (B) The mouse SPIRONs built with transgenic and wild‐type control samples, respectively. In all these networks, lines represent edges that connect an intron to its splicing factor. Only edges with weight >0.2, indicating absolute correlation between an intron and its splicing factor are shown for visualization; yellow circles and blue hexagons represent splicing factors and introns, respectively. Purple and gray edges indicate positive and negative regression coefficients in the LASSO model, respectively. Genes with more than 15 first‐degree neighbors are labeled. (C) Comparison of the degree (left panel) and average weight (right panel) of each splicing factor between the control and AD‐specific SPIRONs. (D) The correlation of the eigengene (PC1 stands for the first principal component) of the SF3B4 and SNRPA1 module with Braak scores