
FIGURE 1.
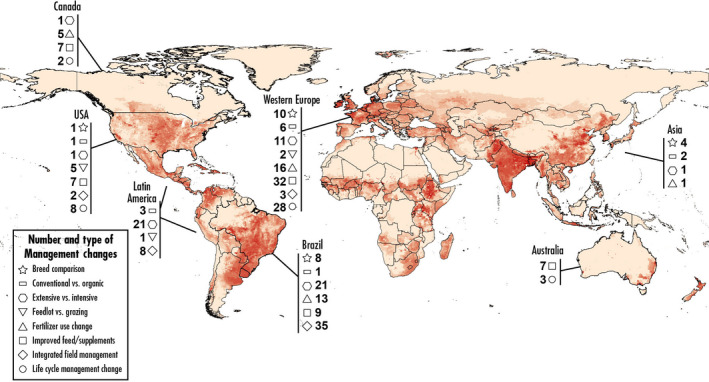
Map of the distribution of management changes considered in LCA studies by region. The number and type of management change for calculated Effect Sizes from LCA studies is shown for regions globally, with red shading showing the relative distribution of cattle globally (data source = FAO Global Livestock Environmental Assessment Model; GLEAM). Note that most regions with high density of cattle have comparative LCA studies, except Africa and India. In India, cattle density is very high but there is virtually no beef production from cattle.