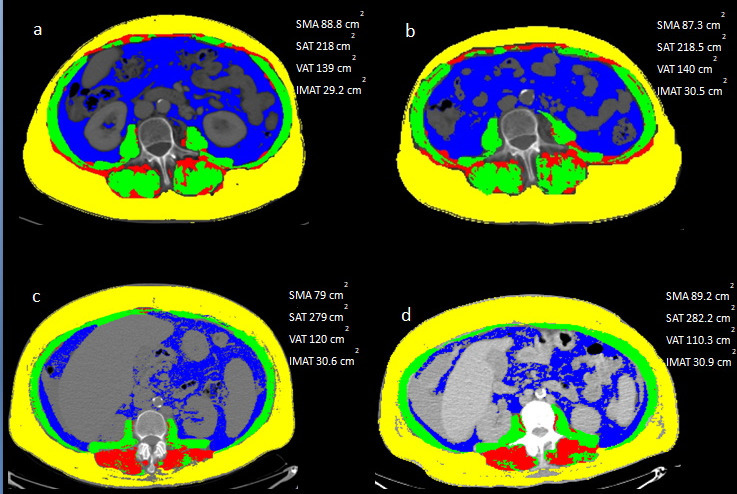
Figure 2.

A representative case of measurements of SAT (yellow), VAT (blue), IMAT (red) and SMA (green) using HDCT (a) and LDCT (b) images. Another example with the comparison between HDCT (c) and LCT (d). HDCT, high-dose computedtomography; IMAT, intramuscular adiposetissue; LDCT, low-dose CT; SAT, subcutaneous adiposetissue; SMA, skeletal muscle area; VAT, visceral adipose tissue.
