
Figure 4.
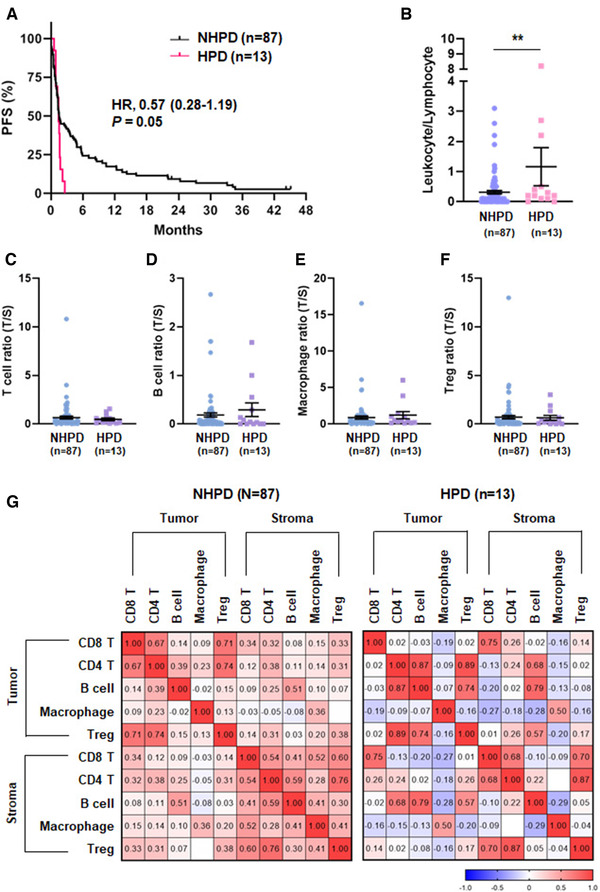
Association of tumor microenvironment and HPD. (A) Kaplan–Meier plots of PFS according HPD (n = 13) and NHPD (n = 87). (B) Leukocyte to lymphocyte ratio in the tumor region and measured by multiplex IHC. (C‐F) Tumor to stroma ratio of T cell (C), B cell (D), macrophage (E), and Treg (F) proportion and measured by multiplex IHC. Data are represented as dot plots (bar: mean ± SEM) (*p < 0.05; **p < 0.01 by unpaired t‐test). (G) Pearson‐correlation matrix of five immune cell types in the tumor and stromal regions according HPD. HPD, hyperprogressive disease; NHPD, nonhyperprogressive disease. (B‐G) Data from multiplex IHC experiments. All the slides of the 100 samples were collected on the same day and the experiments performed on several days.