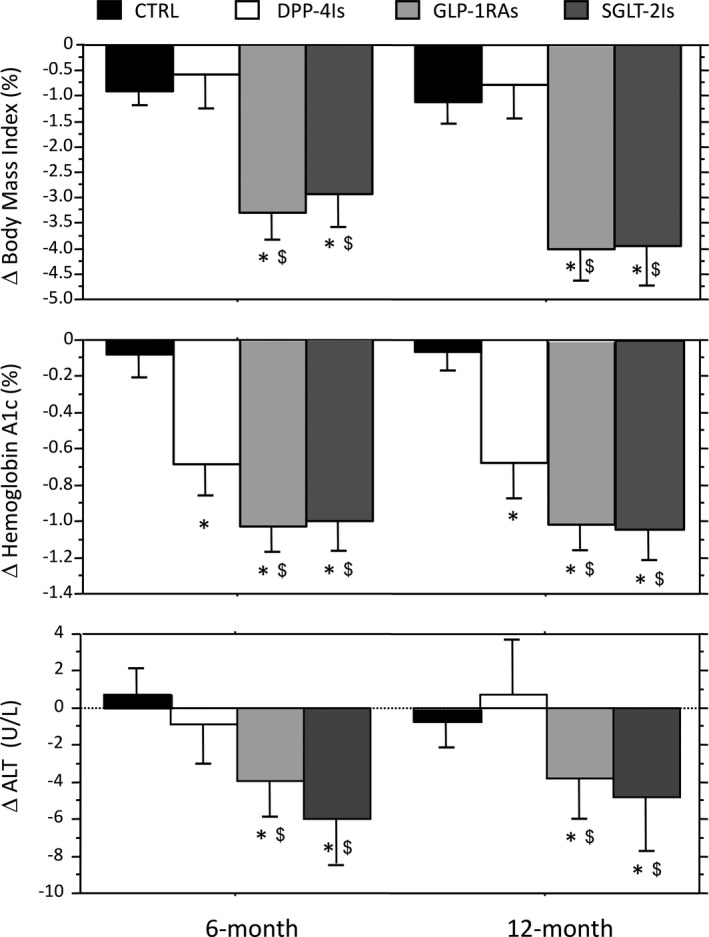
FIGURE 1.

Changes in BMI, glycosylated haemoglobin and alanine aminotransferase levels at 6 and 12 mo in the groups treated by the different glucose‐lowering drug classes. Data are expressed as mean and 95% confidence interval. CTRL represents continuous treatment with metformin ± sulfonylureas and/or pioglitazone. *Significantly different from CTRL values. $Significantly different from the corresponding value of the DPP‐4I group. ALT, alanine transaminase; BMI, body mass index; CTRL, controls; DPP‐4Is, dipeptidyl‐peptidase‐4 inhibitors; GLP‐1RAs, glucagon‐like peptide‐1 receptor agonists; SGLT‐2Is, sodium‐glucose cotransporter‐2 inhibitors
