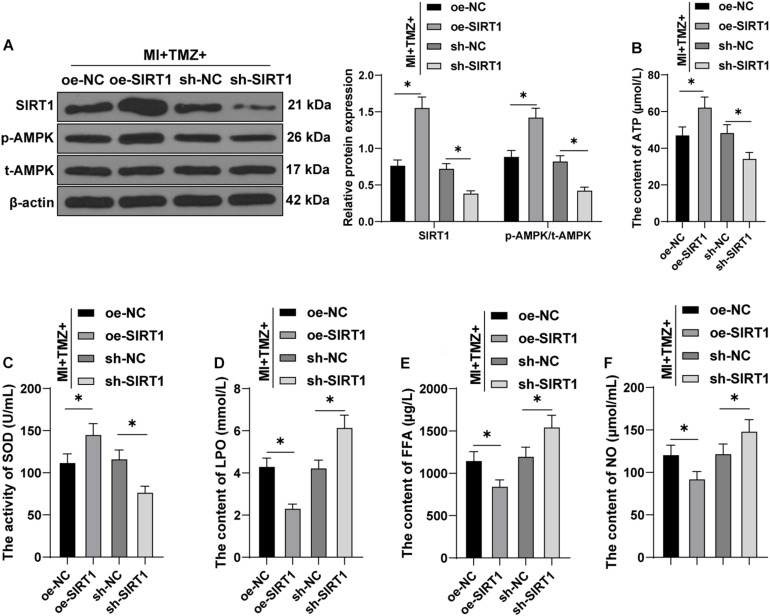
FIGURE 5.
Trimetazidine inhibited MI-induced myocardial energy metabolism via the SIRT1–AMPK pathway in vivo. (A) Western blot analysis of SIRT1, p-AMPK, and t-AMPK. (B) ATP content in H9C2 cardiomyocytes. (C) SOD activity in H9C2 cardiomyocytes. (D–F) Contents of LPO (D), FFA (E), and NO (F) in H9C2 cardiomyocytes (N = 10 per group). All data were expressed as the mean ± standard deviation. Data were analyzed using one-way ANOVA, followed by Tukey’s multiple comparisons test. *P < 0.05. ATP, adenosine triphosphate; SOD, superoxide dismutase; LPO, lipid peroxide; FFA, free fatty acids; NO, nitric oxide.

