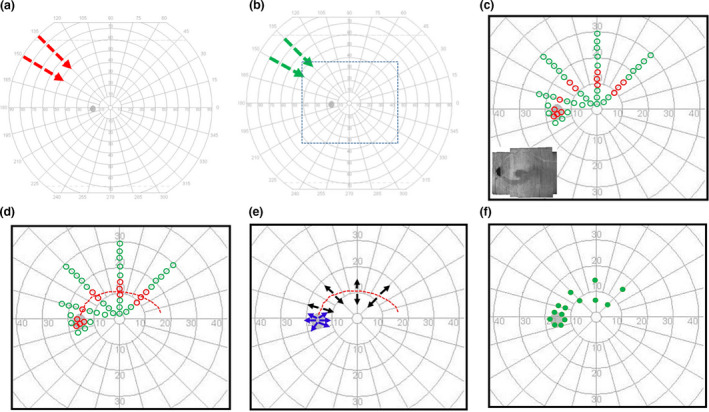
Figure 1.

Schematic illustration of testing protocol. (a) Step 1 ‐ testing pattern for training study participants for kinetic testing superimposed on the user interface of the Octopus 900 perimeter. The arrows show examples of the direction and spacing of stimulus presentation. (b) Step 2 ‐ preliminary G‐II stimulus testing for estimating G‐II luminance for the subsequent steps of testing. The nature of testing was same as in (a). The short dashes enclose the central ± 30° which was our region of interest (ROI) (c) Step 3 ‐ the pattern of static suprathreshold testing in the ROI. The green and red markers are schematic representations of retinal locations where the static suprathreshold stimulus was seen and not seen, respectively. The inset shows an example of an en face RNFL image used to guide the selection of the hemifield for perimetric assessment. (d) Step 4 – the arcuate kinetic pattern (shown in red short dashes) used to assess the continuity of the locations of abnormality identified from the static suprathreshold testing in c. (e) Step 5 ‐ centrifugal presentation of the stimulus (black), diverging from the continuous perimetric abnormality defined in d, for identifying the edges of the glaucomatous defect. A similar assessment (shown in blue) was performed at the edge of the physiologic blind spot. (f) The green filled markers show examples of locations at which the kinetic stimulus presented in E was first seen.
