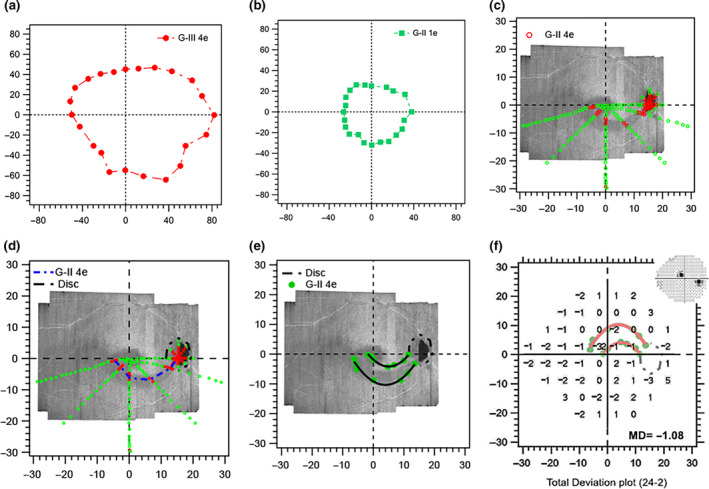
Figure 2.

Findings of Phase 1 testing in Subject 1. (a) Isopter for the G‐III 4e stimulus during kinetic perimetric training. (b) Isopter for the G‐ II 1e stimulus used for estimating G‐II stimulus luminance for suprathreshold static testing. (c) The green and red markers show the results for the suprathreshold testing as locations at which the stimuli presented were seen (green) and not seen (red), respectively. (d) The blue short dashes (arc of functional abnormality) illustrate the path of a 2 ° s−1 kinetic stimulus passing through the unseen locations in c, assessing the continuity of the defect with the physiologic blind spot. The short black dashes illustrate the edge of the physiologic blind spot. (e) The green filled markers show the locations at which the stimuli diverging from the arc of functional abnormality were first seen, and black curves show interpolated edges obtained by 3rd degree polynomial fits to these patterns of locations. (f) Total deviation findings from 24‐2 static perimetry overlaid with the kinetic perimetric findings. The insert is a greyscale image of the 24‐2 sensitivities. All axes are in degrees of visual angle.
