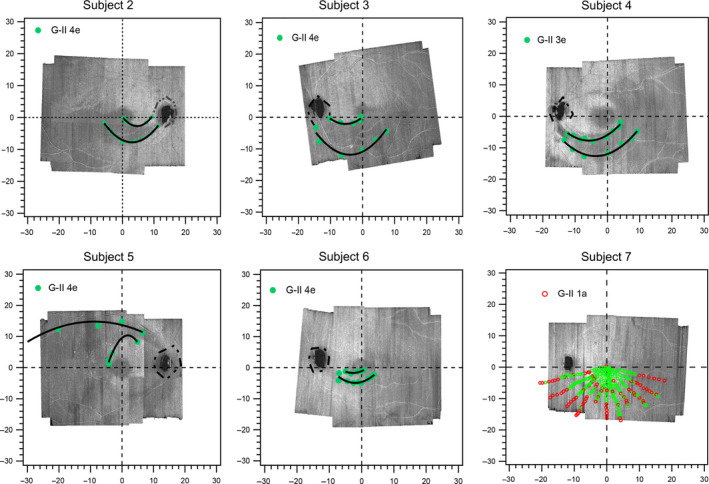
Figure 4.

The edges of the functional abnormalities relative to the edges of the structural abnormalities. The green‐filled markers show the locations at which the centrifugal stimulus moving from non‐seeing locations was first seen. The black lines are third degree polynomial fits used to interpolate between the green markers. For Subject 7, at a dimmer stimulus luminance, a pattern of abnormality began to emerge; however, the defect was so small that it could not be followed with a kinetic strategy amid eye movements.
