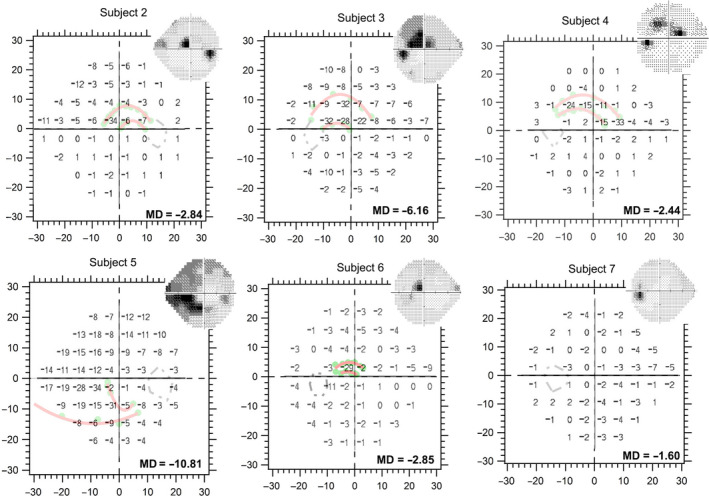
Figure 5.

Kinetic perimetry findings compared to the total deviation findings from static threshold 24‐2 perimetric testing. The insets are greyscale images from the static 24‐2 protocol. The regions of greatest perimetric abnormalities in the retinal hemifield studied, shown as dark shades on the greyscale images, corresponded with the regions identified by kinetic perimetric results as showing abnormalities.
