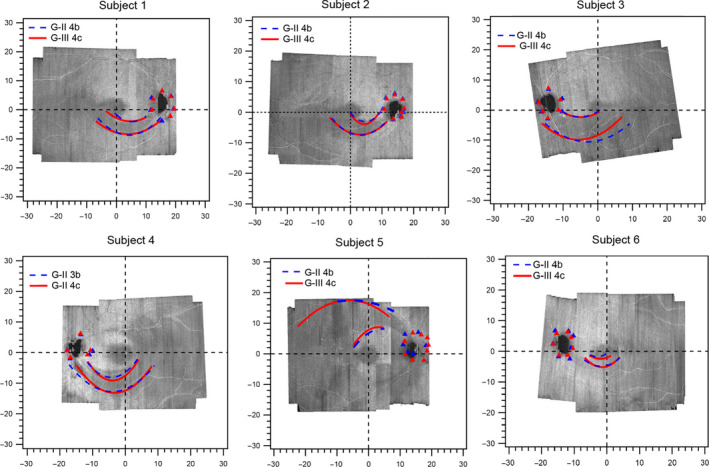
Figure 6.

Functional slope at the edge of the glaucomatous defects superimposed on the optical coherence tomography (OCT) en face images. The red and blue colours show third degree polynomial fits to the edges of the functional defects identified with the two stimuli 6 dB apart. The triangles show the edges of the physiological blind spot. Subject 7 was not included because we were unable to follow the findings of the static suprathreshold testing with kinetic testing.
