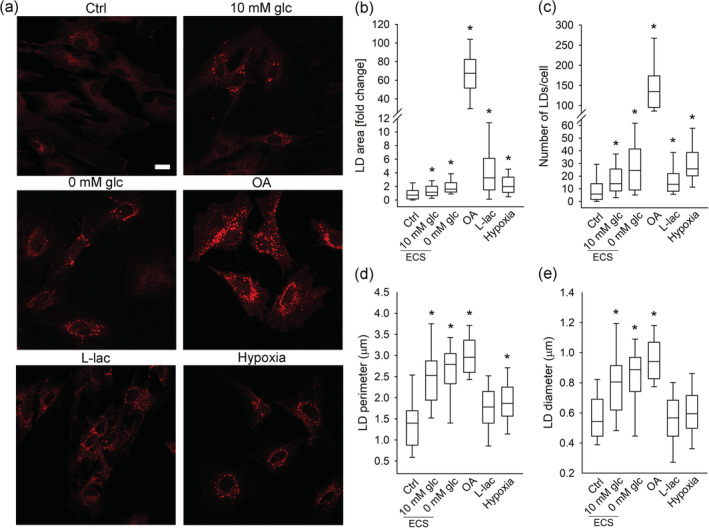
FIGURE 2.

Lipid droplets in isolated astrocytes exposed to nutrient and hypoxic stress. (a) Representative fluorescence images of Nile Red‐labelled isolated astrocytes incubated for 24 hr in growth medium (Ctrl; n = 140 [367 cells]), extracellular solution (ECS) with 10 mM glucose (10 mM glc; n = 74 [143 cells]) or without glucose (0 mM glc; n = 81 [157 cells]), and in growth medium (25 mM glc) with 300 μM oleic acid (OA; n = 23 [53 cells]), 20 mM l‐lactate (l‐lac; n = 43, [164 cells]), and under hypoxia (Hypoxia; n = 53 [139 cells]). Scale bar: 20 μm. (b–e) Box plots (center, median; box, IQR [interquartile range]; whiskers, 10th and 90th percentiles) of Nile Red‐stained area per total cell area normalized to control (LD area [fold change]) (b), number of Nile Red‐stained LDs per cell (c), and perimeter (d) and diameter of Nile Red‐stained LDs (e) upon exposure of astrocytes to stress stimuli. LD perimeter and diameter were measured only in cells that contained LDs (n Ctrl = 107 [220 cells]; n 10 mM glc (ECS) = 43 [79 cells]; n 0 mM glc (ECS) = 42 [75 cells]; n OA = 24 [57 cells]; n l‐lac = 39 [123 cells]; n Hypoxia = 57 [151 cells]). n, number of independent experiments. *p < .05 (ANOVA, Dunn's test). Data for every set of experiments were obtained from at least two different animals [Color figure can be viewed at wileyonlinelibrary.com]
