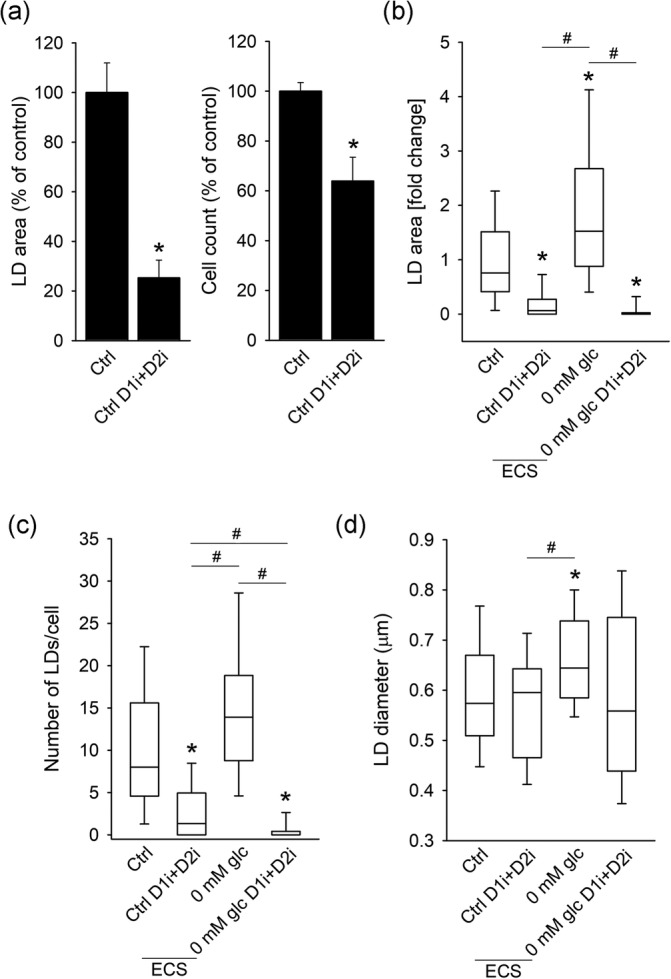
FIGURE 3.

Inhibition of DGAT1 and DGAT2 enzymes in isolated astrocytes decreases cellular LD content and cell number. (a) Mean percentage of Nile Red‐stained cell area per total cell area (LD area) and cell count in astrocytes incubated for 24 hr in growth medium (Ctrl; n for cell count = 7; n for LD area = 49 [281 cells]) or in growth medium upon simultaneous exposure to DGAT1 inhibitor (D1i; 10 μM) and DGAT2 inhibitor (D2i; 10 μM; Ctrl D1i + D2i; n for cell count = 7; n for LD area = 52 [253 cells]) expressed as % of control. (b–d) Box plots (center, median; box, IQR [interquartile range]; whiskers, 10th and 90th percentiles) of Nile Red‐stained area per total cell area normalized to control (LD area [fold change]) (b), number of Nile Red‐stained LDs per cell (c), and diameter of Nile Red‐stained LDs (d) in astrocytes incubated for 24 hr in growth medium (Ctrl; n = 49 [281 cells]), growth medium in combination with DGAT1 and DGAT2 inhibitors (Ctrl D1i + D2i; n = 52 [253 cells]), extracellular solution (ECS) without glucose (0 mM glc; n = 54 [335 cells]) and extracellular solution without glucose in combination with DGAT1 and DGAT2 inhibitors (0 mM glc D1i + D2i; n = 52 [301 cells]). Diameter of LDs was measured only in cells that contained LDs (n Ctrl = 48 [196 cells]; n Ctrl D1i + D2i = 34 [105 cells]; n 0 mM glc (ECS) = 54 [282 cells]; n 0 mM glc (ECS) D1i + D2i = 20 [56 cells]). n, number of independent experiments. *p < .05 versus Ctrl (ANOVA, Dunn's test) and # p < .05 all pairwise (ANOVA, Dunn's test). Data for every set of experiments were obtained from three different animals
