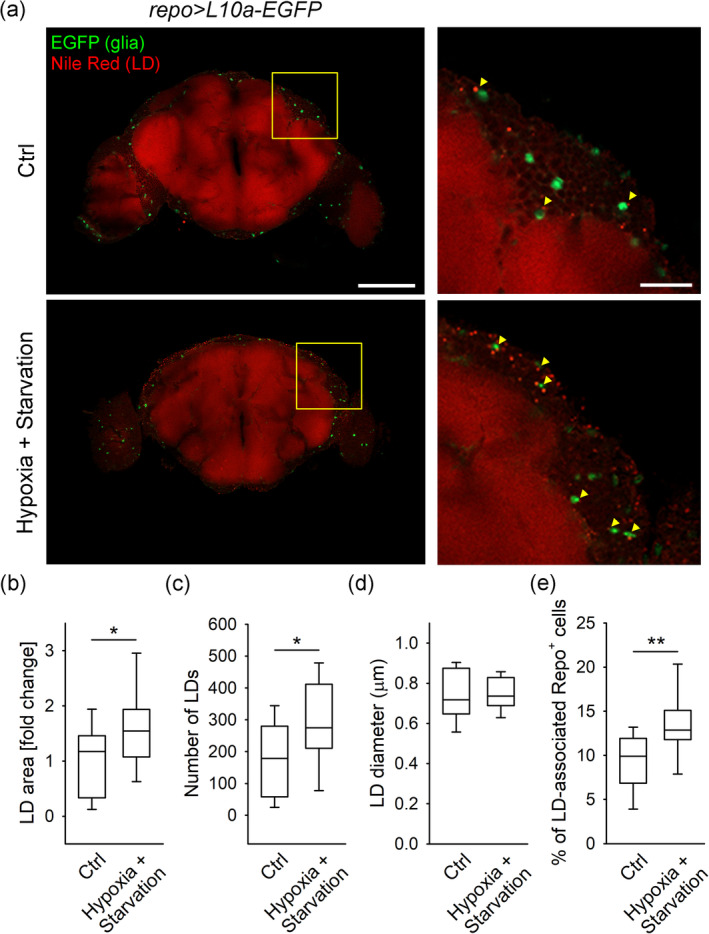
FIGURE 5.

Hypoxia and starvation increases the LD content and the percentage of LD‐associated glial cells in the Drosophila brain. (a) Representative fluorescence confocal images of adult Drosophila brains (left panels) labeled with lipid droplet (LD) marker Nile Red (red) and expressing L10a‐EGFP in glial cells (using the repo‐Gal4 driver; green) isolated from control flies (Ctrl; n = 12, upper panel) and flies exposed to hypoxia and starvation (Hypoxia + Starvation; n = 16, lower panel). Right panels show yellow framed regions at higher magnification. Yellow arrowheads indicate cortical glial cells (green) associated with LDs (red). Shown are single optical sections, recorded by confocal microscope. Scale bars: 100 μm (left panels) and 20 μm (right panels). (b–e) Box plots (center, median; box, IQR [interquartile range]; whiskers, 10th and 90th percentiles) of Nile Red‐labelled area per cortical brain area (LD area [fold change]) normalized to control (b), number of LDs (c), LD diameter (d) and percentage of LD‐associated glial (Repo+) cells (e) in the brains from controls and flies exposed to hypoxia and starvation. Note that exposure of flies to hypoxia and starvation increases the brain LD area, LD number, and the proportion of glial (Repo+) cells associated with LDs. Only male flies were used. All experiments were performed under noncrowded conditions (<15 flies per vial) in duplicate. n, number of independent experiments, *p < .05, **p < .01; Mann–Whitney Rank Sum Test (b and e) and Student's t‐test (c) [Color figure can be viewed at wileyonlinelibrary.com]
