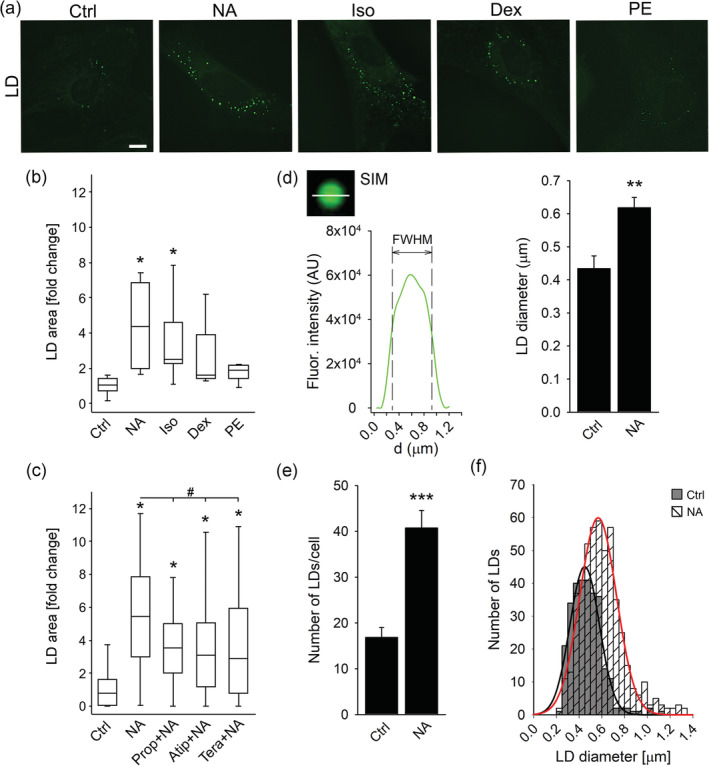
FIGURE 6.

Noradrenaline increases the number and size of LDs in isolated astrocytes through activation of β‐adrenergic receptors. (a) Representative fluorescence images of isolated astrocytes incubated for 24 hr in growth medium without (Control; n = 6 [113 cells]) and with various adrenergic receptor (AR) agonists, nonselective α‐/β‐AR agonist noradrenaline (NA; 100 μM; n = 4 [156 cells]), selective β‐AR agonist isoprenaline (Iso; 100 μM; n = 5 [114 cells]), selective α2‐AR agonist dexmedetomidine (Dex; 50 nM; n = 3 [120 cells]), selective α1‐AR agonist phenylephrine (PE; 100 μM; n = 4 [126 cells]), and labelled with LD marker BODIPY493/503 (green). Scale bar: 10 μm. (b, c) Box plots (center, median; box, IQR [interquartile range]; whiskers, 10th and 90th percentiles) of LD marker stained area per total cell area normalized to control (LD area [fold change]) in untreated astrocytes (Control; Ctrl) and in astrocytes exposed to (b) various AR agonists and (c) to NA (100 μM; n = 47 [98 cells]) in the presence of various AR antagonists, β‐AR antagonist propranolol (1 μM; Prop + NA; n = 54 [121 cells]), α2‐AR antagonist atipamezole (10 μM; Atip + NA; n = 57 [124 cells]), and α1‐AR antagonist terazosin (10 μM; Tera + NA; n = 56 [136 cells]). (d, e) Mean LD diameter (d) and mean LD number per cell (e) in control untreated cells (Ctrl; n for LD diameter = 6 [14 cells] and n for LD number = 7 [73 cells]) and in cells exposed to NA (n for LD diameter = 9 [13 cells] and n for LD number = 11 [91 cells]) for 24 hr. The apparent LD diameter was determined by structured illumination microscopy measuring the full width at half maximum (FWHM) of the BODIPY493/503 fluorescence intensity profile in two perpendicular directions (only the horizontal direction is displayed; d, left panel). Bars represent means ± SEM. n, number of independent experiments. *p < .05, **p < .01, and ***p < .001 versus control and # p < .05 versus NA (ANOVA, Dunn's test (b and c) and Student's t‐test (d and e)). (f) Frequency distribution of LD diameter in untreated controls (grey bars) and in cells treated with NA (striped bars) for 24 hr. Gaussian curves were fitted to LD diameter frequency distributions in untreated controls (black line; 287 analyzed LDs) and cells treated with NA (red line; 498 analyzed LDs). The mean peak values of the curves are 449 ± 8 nm in controls and 567 ± 7 nm in NA‐treated cells. Data for every set of experiments were obtained from at least two different animals [Color figure can be viewed at wileyonlinelibrary.com]
