
FIGURE 7.
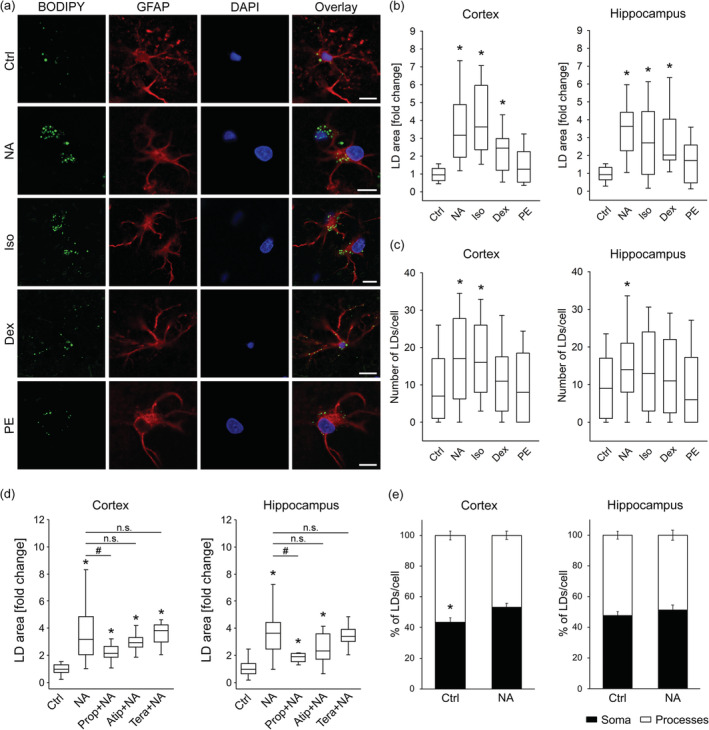
Noradrenaline‐induced LD accumulation in brain tissue astrocytes through activation of β‐ and α2‐adrenergic receptors. (a) Representative fluorescence images of brain tissue astrocytes stained with BODIPY493/503 (BODIPY; green), antibodies against astrocytic marker glial fibrillary acidic protein (GFAP, red), nuclear marker 4′,6‐diamidino‐2‐phenylindole (DAPI; blue), and merged images (Overlay) incubated for 24 hr in growth medium without (Control; Ctrl, 25 mM glucose; number for cortex (n C) = 39 [403 cells]; number for hippocampus (n H) = 38 [349 cells]) and with various adrenergic receptor (AR) agonists: nonselective α‐/β‐AR agonist noradrenaline (NA; 100 μM; n C = 27 [242 cells]; n H = 24 [164 cells]), selective β‐AR agonist isoprenaline (Iso; 100 μM; n C = 12 [100 cells]; n H = 13 [89 cells]), α2‐AR agonist dexmedetomidine (Dex; 50 nM; n C = 12 [99 cells]; n H = 10 [79 cells]), and α1‐AR agonist phenylephrine (PE; 100 μM; n C = 14 [105 cells]; n H = 14 [124 cells]). Scale bars: 10 μm. (b–d) Box plots (center, median; box, IQR [interquartile range]; whiskers, 10th and 90th percentiles) of BODIPY493/503‐stained area per total cell area normalized to control (LD area [fold change]) (b, d) and number of BODIPY493/503‐stained LDs per cell (c) in untreated control astrocytes (Ctrl) and (b, c) astrocytes exposed to various AR agonists and (d) NA (100 μM) in combination with various AR selective antagonists (10 μM); β‐AR antagonist propranolol (Prop + NA; n C = 12 [123 cells]; n H = 10 [64 cells]), α2‐AR antagonist atipamezole (Atip + NA; n C = 11 [94 cells]; n H = 10 [93 cells]), and α1‐AR antagonist terazosin (Tera + NA; n C = 12 [126 cells]; n H = 8 [65 cells]), separately for cortical (Cortex) and hippocampal (Hippocampus) tissue astrocytes. (e) Mean percentage of BODIPY493/503‐stained LDs per cell soma (black bars) and processes (white bars) in untreated control astrocytes (Ctrl; n C = 15 [111 cells]; n H = 15 [114 cells]) and astrocytes exposed to NA (n C = 10 [64 cells]; n H = 8 [48 cells]), separately for cortical and hippocampal brain area. Bars represent means ± SEM. n, number of independent experiments. *p < .05 versus Control and # p < .05 versus NA (ANOVA, Dunn's test (b–d)), *p < .05 all pairwise (ANOVA, Dunn's test (e)), n.s., not significant. Data for every set of experiments were obtained from at least two different animals [Color figure can be viewed at wileyonlinelibrary.com]