
FIGURE 8.
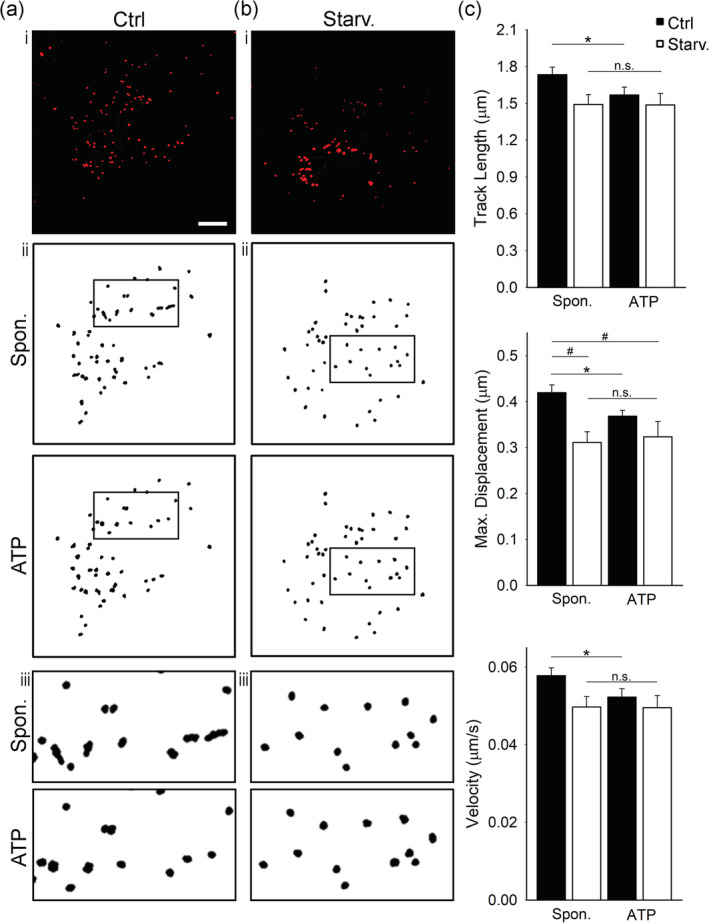
Mobility of LDs is reduced in glucose‐deprived and ATP‐stimulated isolated cortical astrocytes. (a‐b, i) Representative fluorescence images of Nile Red‐labelled isolated astrocytes incubated for 24 hr in (a, i) growth medium (Control; Ctrl, 25 mM glucose) and (b, i) under nutrient deprivation (10 mM glucose, Starv.). Red puncta represent fluorescently labeled lipid droplets (LDs). (a‐b, ii and iii [insets]) Trajectories of 50 Nile Red‐labelled LDs in a representative cell 60 s before (Spon.; upper panels) and 60 s after stimulation with ATP (ATP, 100 μM; lower panels in control (Ctrl) and under starvation (Starv.). Insets (iii) show black‐boxed regions in (ii) at higher magnification. Scale bar: 10 μm. (c) Histograms of average LD track length, maximal displacement and velocity 60 s before (Spon.) and 60 s after the addition of ATP (ATP, 100 μM) in control (Ctrl; black bars; n = 28 [1,316 LDs]) and under nutrient deprivation (Starv.; white bars; n = 8 [514 LDs]). All mobility parameters were reduced by >10% under nutrient deprivation in spontaneous and in ATP‐stimulated conditions. *p < .05 (paired t‐test), # p < .05 (ANOVA, Dunn's test). Data for every set of experiments were obtained from at least two different animals [Color figure can be viewed at wileyonlinelibrary.com]