
FIGURE 4.
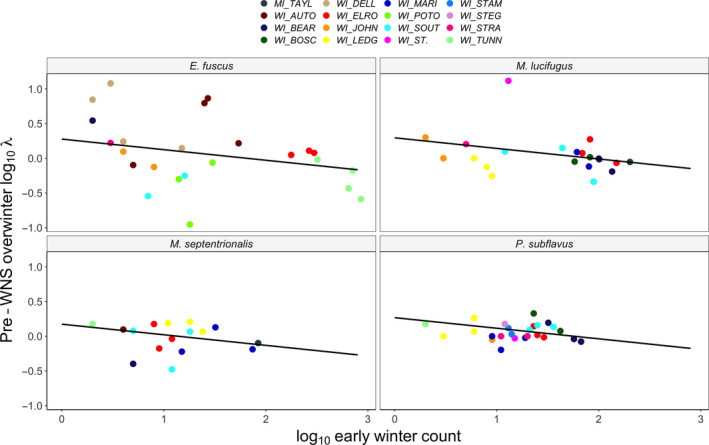
Pre‐WNS immigration rates show dynamic populations during winter. Panels show bat species and colours indicate different bat populations. Lines show the fitted relationship between log10 early winter counts of bats and the rate of change in the same population over winter. Model diagnostics are shown in Figure S2 and Appendix S1. Despite cold (<5°C) temperatures, there was detectable immigration and emigration among hibernation sites, consistent with bats moving from larger to smaller colonies over winter