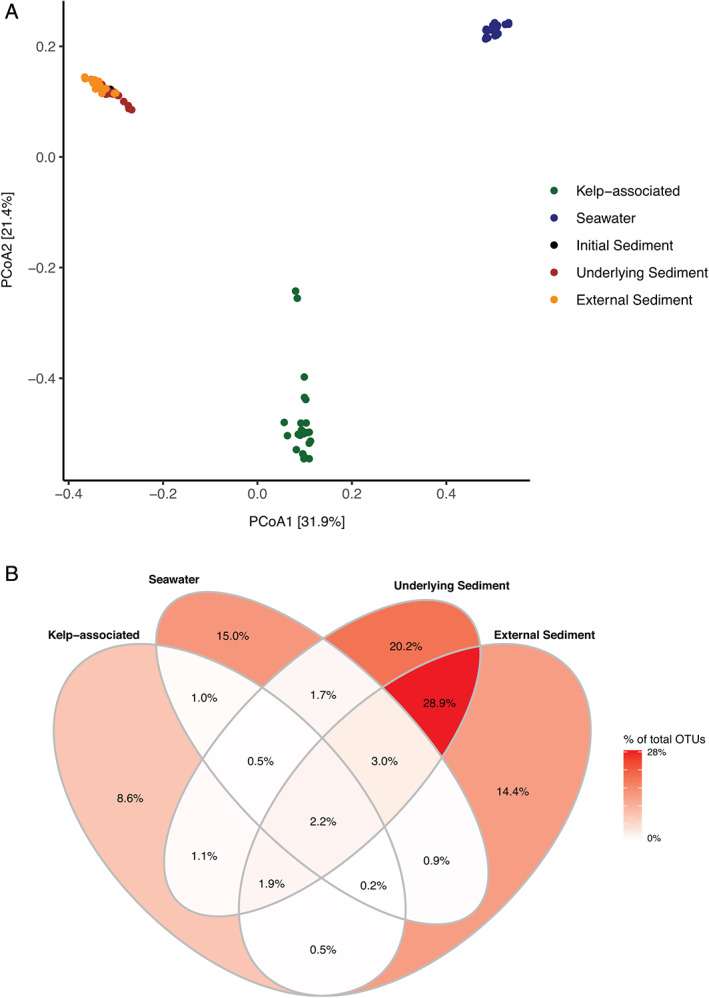
Fig 2.

Bacterial community structure in the four compartments during the degradation of detached L. hyperborea. A. Two‐dimensional representation of a PCoA calculated from the Bray–Curtis dissimilarity index. The plot represents samples from all time points. B. Proportion of OTUs unique to one compartment or shared between compartments, calculated from the total number of 88 194 OTUs in the dataset. [Color figure can be viewed at wileyonlinelibrary.com]
