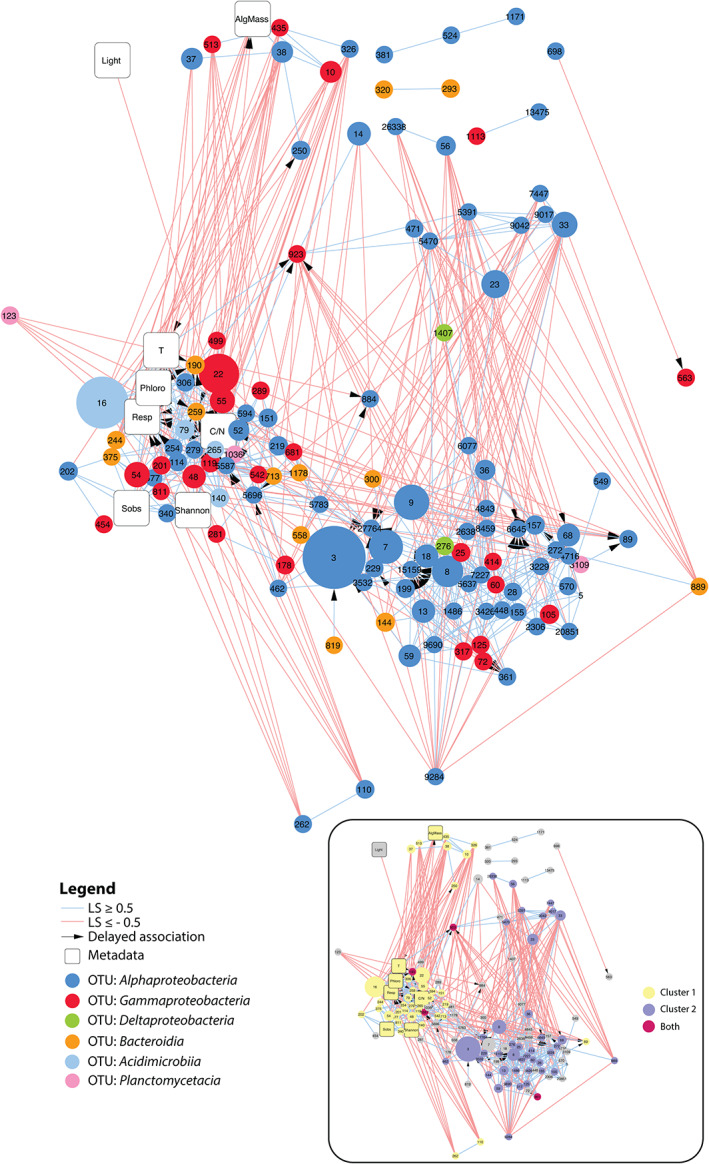
Fig 4.

Extended local similarity analysis (eLSA) network obtained for kelp‐associated bacterial communities throughout the eight sampling time points. OTU nodes are colour‐coded based on taxonomy, and their size is proportional to the median relative abundance throughout the experiment. Positive and negative associations are depicted by light blue and light red lines, respectively. Arrows indicate delayed temporal associations (maximum delay = 1 sampling date). Network characteristics were as follows: clustering coefficient 0.358; characteristic path length 3.171; diameter 8; average number of neighbours 8.54; maximum number of neighbours 23; network density 0.064. Inset: the same network where nodes are coloured depending on their belonging to the main cluster 1 (yellow) and cluster 2 (purple) or both (crimson). AlgMass: remaining algal biomass; T: water temperature; Phloro: concentration of phlorotannins in kelp tissue; Resp: community respiration; Sobs: number of bacterial OTUs; C/N: carbon to nitrogen ratio of kelp tissue. [Color figure can be viewed at wileyonlinelibrary.com]
