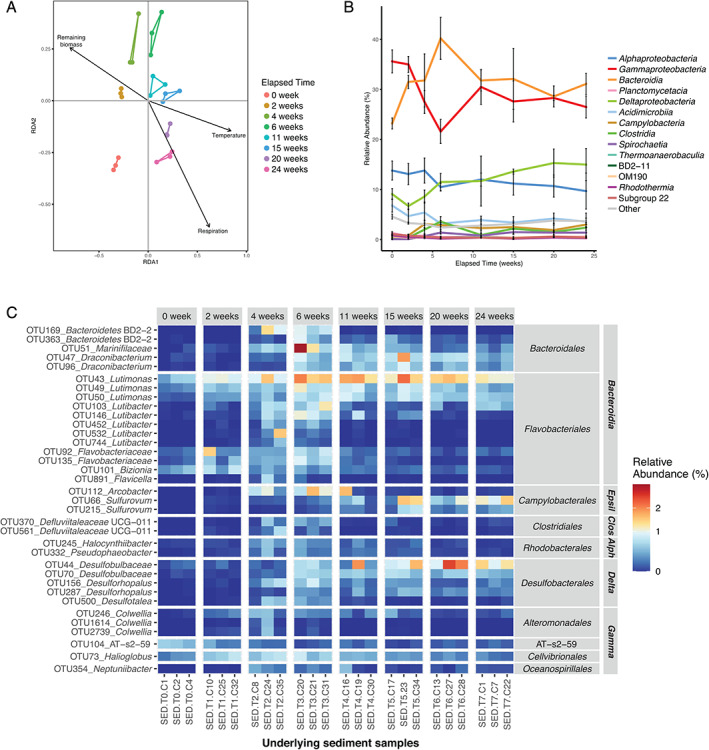
Fig 6.

Fluctuations of bacterial community structure in the sediment underlying L. hyperborea during its degradation. A. db‐RDA plot with vectors representing significant contextual predictors. Samples from the same sampling date are connected by coloured segments. B. Relative abundance of bacterial classes in underlying sediment samples during the 6 month‐experiment. Sequence relative abundances of classes representing less than 0.5% of all sequences at each sampling time were summed into the ‘Other’ category. Values are mean ± standard deviation (n = 3). C. Relative abundance of differentially abundant OTUs in the underlying sediment during the experiment. OTUs showing significant differential abundance (P < 0.05) and representing at least 0.5% of the sequences in at least one sample are shown. OTUs were annotated at the genus level. For unclassified genera, taxa were assigned to the lowest taxonomic level identified. OTUs were grouped by class and order. Epsil: Epsilonproteobacteria; Clos: Clostridia; Alph: Alphaproteobacteria; Delta: Deltaproteobacteria; Gamma: Gammaproteobacteria. [Color figure can be viewed at wileyonlinelibrary.com]
