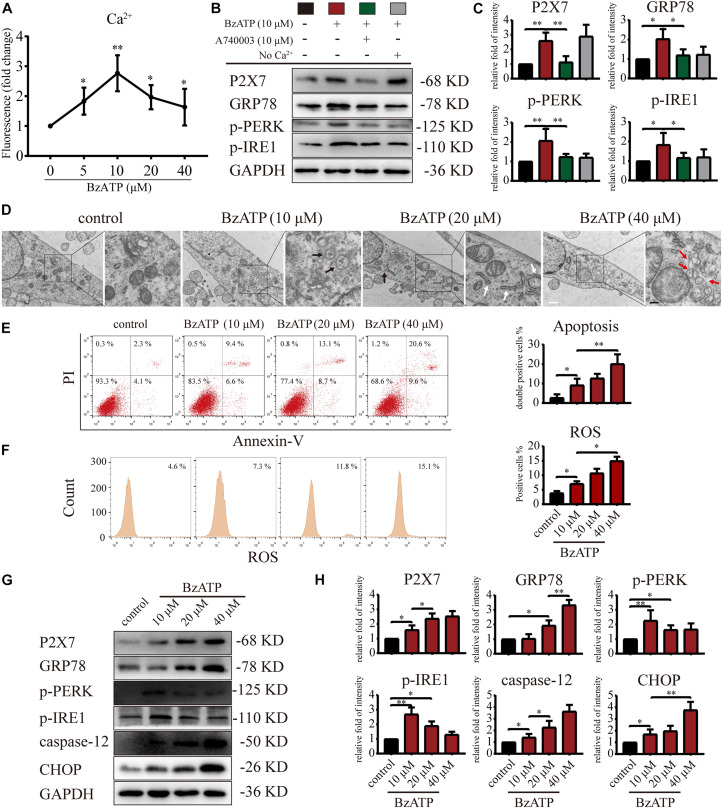
FIGURE 3.
P2X7 activation triggers Ca2+ overload and induces ER stress. (A) Cells were cultured with different concentrations of Bz-ATP (0, 5, 10, 20, and 40 μM), the fluorescence signal was detected by the microplate reader, and the Ca2+ content in the ER was determined. (B,C) Cells were cultured with 10 μM Bz-ATP, 10 μM A740003, or Ca2+-free medium as described in section “Materials and Methods.” Western blotting was used to detect the protein levels of P2X7, GRP78, PERK, and IRE1. (C) Quantification of western blotting results. (D) Cells were cultured with different concentrations of Bz-ATP (0, 10, 20, and 40 μM) as described in section “Materials and Methods,” and TEM was used to evaluate cell morphology and subcellular structures (black arrows: autolysosomes; white arrows: the expansion of ER; red arrows: vesicles; white bar: 2 μm. black bar: 1 μm). (E–F) To detect the proportion of apoptotic cells and the level of oxidative stress, cells were stained with Annexin-V/PI and ROS and analyzed by flow cytometry. (G,H) Cells were cultured with different concentrations of Bz-ATP (0, 10, 20, and 40 μM), and the protein levels of P2X7, GRP78, p-PERK, p-IRE1, caspase-12, and CHOP were detected by western blotting. (H) Quantification of western blotting results. Data are expressed as means ± standard deviations of at least three independent experiments. ∗p < 0.05, ∗∗p < 0.01.

