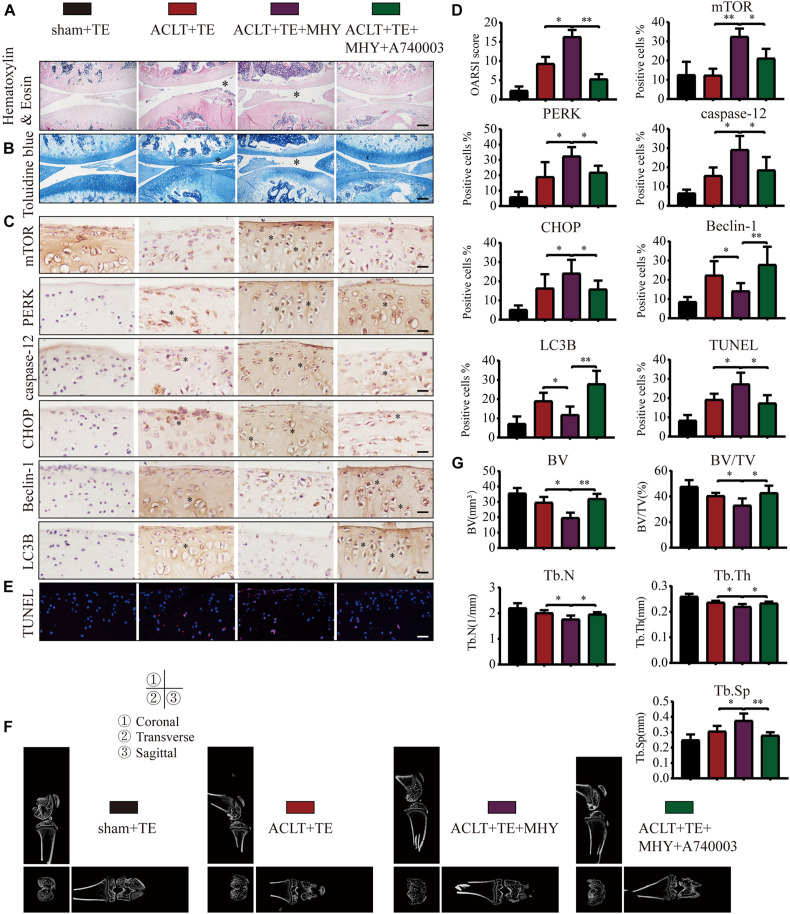
FIGURE 9.
mTOR activation inhibits autophagy, induces apoptosis, and increases cartilage loss. The sagittal sections of knee joints were stained with H&E (A) and TB (B) at 4-week time point (scale bar: 500 μm). The degree of cartilage loss and matrix degradation was quantified using the OARSI scoring system; data are presented on the right. (C,D) IHC staining and quantification of mTOR, PERK, caspase-12, CHOP, LC3B, and Beclin-1 was performed to observe changes in the expression levels of these indicators after the intra-articular injections of rapamycin and Bz-ATP (scale bar: 200 μm). (E) TUNEL staining was performed to quantify the number of apoptotic chondrocytes in each group (scale bar: 200 μm). (F) The knee joints in each group were evaluated using micro-CT, and the imaging data of the tibial plateau and subchondral bone were obtained (scale = 1 mm). (G) Quantification of micro-CT bone-related parameters, including BV, BV/TV, Tb.N, Tb.Th, and Tb.Sp. The asterisk in the HE and TB staining images represents the cartilage damage site, and the asterisk in the histochemical images represents the positively stained cells. Data are expressed as means ± standard deviations of at least three independent experiments. ∗p < 0.05, ∗∗p < 0.01.

