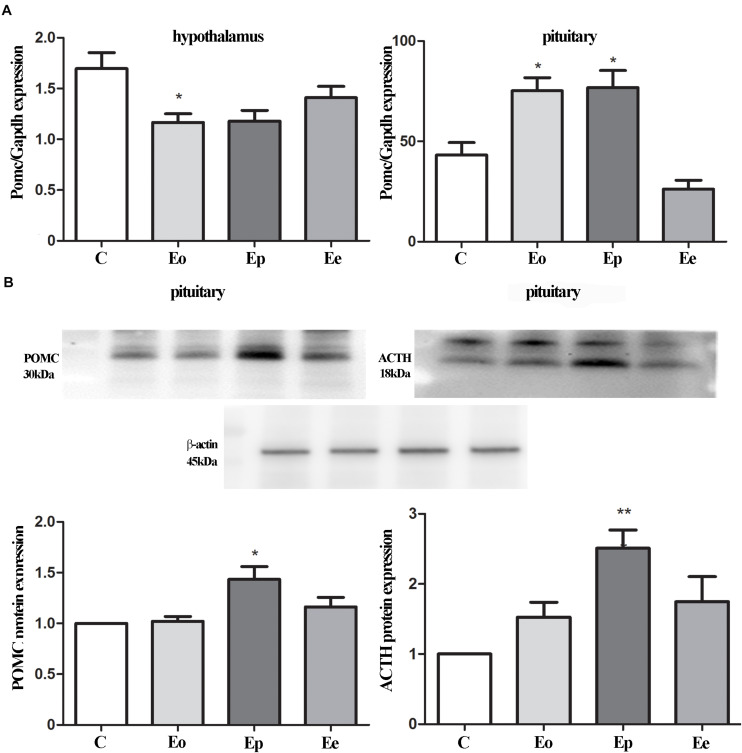
FIGURE 2.
(A) POMC gene expressions were assessed by qRT-PCR in immunized (Eo, Ep, and Ee) and control animals (C–control), with Gapdh as an internal reference standard in the hypothalamus and pituitary. (B) Protein levels of POMC and adrenocorticotropic hormone (ACTH) relative to β-actin in the pituitary were determined using the Western blot method and results are expressed as mean% of control values ± SEM. *p < 0.05; **p < 0.001 compared with the control.

