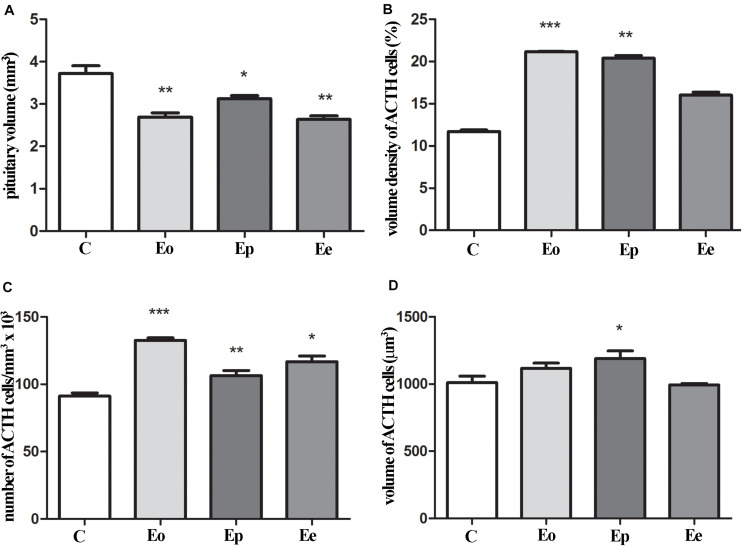
FIGURE 4.
Stereological analysis of the temporal changes of ACTH cells. (A) Changes in the volume of the pituitary during EAE. Variation of ACTH secreting cells in the pituitary in volume density (B), number (C), and volume of the single cell (D) in the course of EAE. Pituitary from control – C and EAE rats, obtained from different time points—Eo (onset of the disease), Ep (peak of the disease), and Ee (end of the disease), and used for determination in morphometric parameters. Results are given as means ± SEM; *p < 0.05, **p < 0.01, and ***p < 0.001 on a corresponding day.

