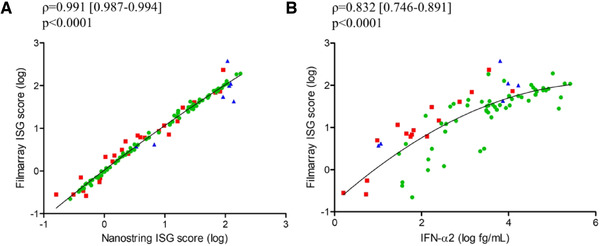
Figure 1.

Type‐I Interferon quantification using FilmArray® platform. (A) Spearman correlation [IC95%] between ISG score as defined by a 6‐interferon stimulated gene transcriptional signature using Nanostring® platform and ISG score as defined by a 4‐interferon stimulated gene transcriptional signature using FilmArray® technology, obtained from whole blood from (i) febrile infants (n = 86 patients from one experiment, green circle) with proven infections attending pediatric emergency departments, (ii) patients with severe infection caused by SARS‐CoV2 hospitalized in the ICU (n = 26 patients from one experiment, red square), and (iii) healthcare workers with COVID‐19 with mild symptoms (n = 7 patients from one experiment, blue triangle) (ρ = 0.991). (B) Spearman correlation between ISG score as defined by a 4‐interferon stimulated gene transcriptional signature using FilmArray® technology and IFN‐α2 concentrations measured by SIMOA® platform, obtained from whole blood from (i) febrile infants (n = 56 patients from one experiment, green circle) with proven infections attending pediatric emergency departments, (ii) patients with severe infection caused by SARS‐CoV2 hospitalized in the ICU (n = 16 patients from one experiment, red square), and (iii) healthcare workers with COVID‐19 with mild symptoms (n = 7 patients from one experiment, blue triangle) (ρ = 0.832). Patients are represented by different forms and nonlinear regression (second order polynomial, quadratic) is represented by a black line. IFN (Interferon), ISG (Interferon Stimulated Genes).
