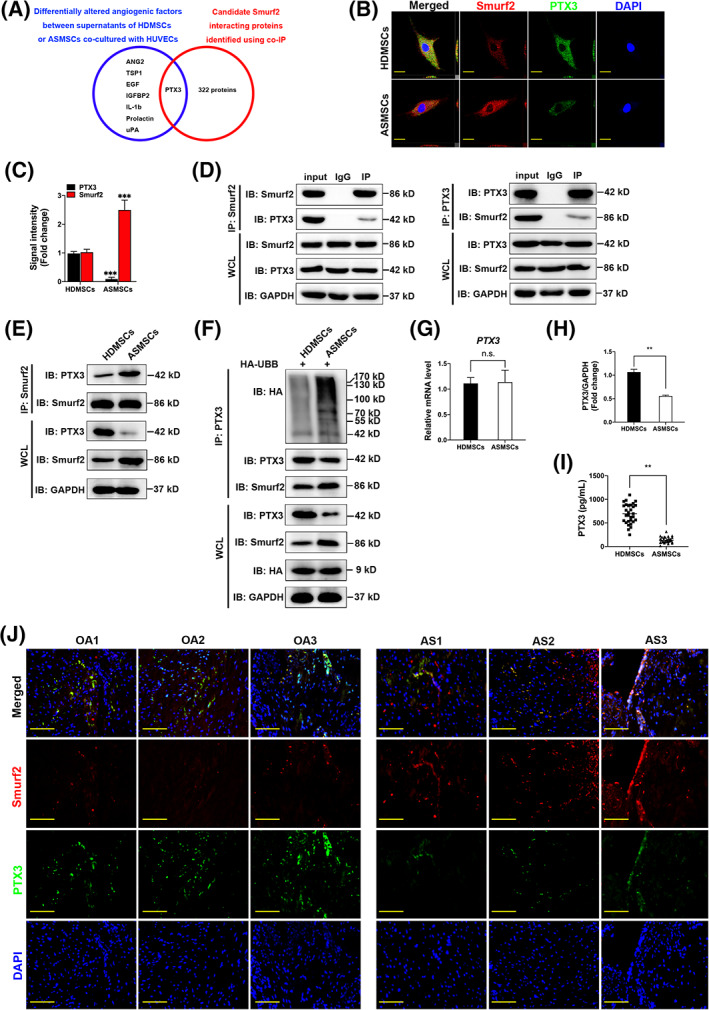
FIGURE 4.

PTX3 is a Smurf2 target in mesenchymal stem cells (MSCs) in patients with ankylosing spondylitis (AS) (ASMSCs). A, Venn diagram showing the differentially altered angiogenic factors between supernatants of MSCs in patients with healthy donors (HDMSCs) or ASMSCs cocultured with human umbilical vein endothelial cells (HUVECs; blue), candidate Smurf2‐interacting proteins in ASMSCs identified in the co‐IP (red) and overlapping PTX3 datasets. B, Immunofluorescence (IF) staining showing the colocalization of Smurf2 and PTX3 both in HDMSCs and ASMSCs. Compared with HDMSCs, the expression of Smurf2 increased, and the expression of PTX3 decreased in ASMSCs (red, Smurf2; green, PTX3; blue, DAPI; scale bar = 20 μm). C, Quantitative analysis of the signal intensity in (B) (n = 10 different HDMSC or ASMSC lines per group). D, By detecting the protein expression of whole‐cell lysates (WCL) in each group, it was proven that the protein lysates enriched for the target protein by IP or IgG negative control were equivalent. Co‐IP mixtures were evaluated using Western blotting. Endogenous Smurf2 and PTX3 interacted with each other in ASMSCs (n = 10 different ASMSC lines per group). E,H, PTX3 and Smurf2 interacted with each other both in HDMSCs and ASMSCs. Compared with that in HDMSCs, the level of the PTX3 protein was decreased in ASMSCs, but the strength of the Smurf2‐PTX3 interaction was increased (n = 10 different HDMSC or ASMSC lines per group). F, The transfection efficiency of HA‐UBB was equal. After overexpression of HA‐UBB in MSCs, lower protein levels and increased ubiquitination of PTX3 were observed in ASMSCs compared to HDMSCs (n = 10 different HDMSC or ASMSC lines per group). G, Similar levels of the PTX3 mRNA were detected in HDMSCs and ASMSCs (n = 10 different HDMSC or ASMSC lines per group). I, PTX3 secretion into the supernatants of HDMSCs or ASMSCs cocultured with HUVECs was measured using an ELISA (n = 30 different HDMSC or ASMSC lines per group). J, Based on IF staining, the expression levels of Smurf2 and PTX3 were negatively correlated in patients with AS. Compared to those in patients with OA, Smurf2 was expressed at higher levels, whereas PTX3 was expressed at lower levels in patients with AS (red, Smurf2; green, PTX3; blue, DAPI; n = 10 patients per group; scale bar = 50 μm). All data are presented as the means ± SD. **P < .01, ***P < .001. n.s., not significant
