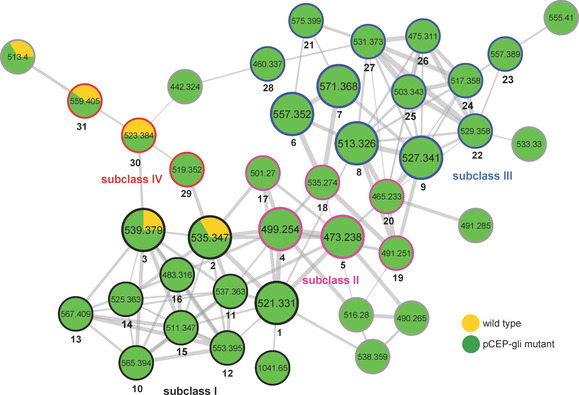
Figure 2.

GLNP subnetwork of molecular networking for MeOH extracts of P. laumondii wild type and pCEP_gli mutant. The nodes in large circles represent the isolated derivatives (1–9). The edges of nodes in colors represent subclass I (black), II (pink), III (blue) and IV (red) of GLNPs. Detailed annotations for the 31 identified nodes (1–31) are presented in Table 1. The overall network is presented in Figure S5.
